Lattice parameters and phase concentrations are the two direct structural fingerprints that powder XRD provides for doped ceramics like yttria-stabilized zirconia (YSZ) processed in lab furnaces. By measuring the precise angles at which X‑rays diffract from ordered crystal planes, you can calculate the unit cell dimensions that expand or contract with dopant incorporation. Simultaneously, analyzing the intensity of those diffraction peaks—either by matching reference databases or by using full‑pattern Rietveld refinement—quantifies the weight fraction of each crystalline phase present, typically down to a detection limit of 0.1–1 wt%.
XRD transforms angular data into actionable structural insight: peak positions reveal lattice parameters that confirm solid‑solution formation, while peak intensities deliver quantitative phase maps. Together, they provide the analytical feedback needed to validate sintering schedules, catch deleterious secondary phases, and optimize the thermal processing of doped ceramics.
How Powder XRD Reveals Lattice Parameters in Doped Ceramics
The Geometry of Dopant Incorporation
When a dopant like Y₂O₃ is introduced into a ZrO₂ host lattice, it substitutes host ions and often creates charge‑compensating defects. This substitution alters the average interplanar spacing of the crystal. According to Bragg’s law (2d sinθ = nλ), a change in those d‑spacings shifts the diffraction peaks to different angles.
Researchers measure the exact position of a set of reflections and refine the unit cell parameters by indexing the pattern. A systematic shift toward lower 2θ angles, for example, indicates an expanded lattice—direct evidence that the dopant has entered the crystal structure rather than remaining as a separate phase.
Direct Evidence of Solid‑Solution Formation
In the classic YSZ system, trivalent Y³⁺ ions replace some tetravalent Zr⁴⁺ ions, introducing oxygen vacancies for charge neutrality. This defect chemistry causes a measurable lattice expansion, most easily seen as a shift of the tetragonal or cubic reflections to lower angles relative to pure zirconia.
By tracking the evolution of the refined lattice parameter a as a function of dopant concentration, you can confirm the limit of solid solubility. An unchanging lattice parameter beyond a certain dopant level tells you that the host lattice is saturated and that additional dopant likely forms second phases. High‑resolution scans and an internal standard (such as NIST silicon) ensure that instrumental offsets don’t mask these subtle shifts.
Quantifying Phase Concentrations from Diffraction Patterns
The Principle of Quantitative Phase Analysis
The integrated intensity of a diffraction peak for a given phase is, in principle, proportional to the amount of that phase present in the sample. Quantitative XRD methods turn relative intensities into weight percentages by comparing the measured intensity to that of a reference phase, by using a reference intensity ratio (RIR), or by modeling the entire diffraction pattern.
Because elemental techniques like XRF or ICP can only report total elemental composition, they cannot distinguish crystalline ZnO from crystalline Al₂O₃ in a mixed powder. XRD, relying on coherent scattering from specific crystal planes, uniquely identifies compounds and their concentrations. Detection limits typically fall in the 0.1–1 wt% range, depending on crystallinity and matrix absorption.
Rietveld Refinement: The Full‑Pattern Approach
The Rietveld method fits a calculated diffraction profile—based on the crystal structures of all suspected phases—directly to the observed pattern. It simultaneously refines structural parameters (lattice dimensions, atomic positions, thermal factors) and phase scale factors, from which accurate weight fractions are extracted.
This approach is especially powerful for doped ceramics processed in lab furnaces. It can deconvolve overlapping peaks from tetragonal and cubic ZrO₂ polymorphs, account for background contributions from amorphous phases, and even provide information on crystallite size and microstrain. The result is a robust, quantitative phase map without the need for external calibration standards.
The Internal Standard Method for Spot Checks
For routine process control, many labs blend a known weight fraction of a crystalline internal standard (often silicon or corundum) into the sintered powder. By comparing the intensity of a target phase’s peak to the standard’s known peak, you can calculate the absolute concentration of that phase without modeling every component.
This technique is particularly valuable when the sample contains a significant amorphous fraction from liquid‑phase sintering. Because the internal standard is purely crystalline, the intensity ratio directly yields the crystalline phase content, even if the amorphous halo is ignored. It provides a fast, reliable go/no‑go check for phase purity before mechanical testing or production scale‑up.
The Critical Role of XRD in Furnace Sintering Workflows
Pre‑Sintering Validation of Feedstock Powder
Before a powder ever enters a high‑temperature lab furnace, XRD confirms that the starting material is what it claims to be. A quick scan can reveal unwanted precursor phases, incomplete solid‑solution formation, or significant amorphous content.
This validation is critical because the presence of even a few weight percent of a secondary phase can drastically alter the sintering kinetics, leading to differential shrinkage, warping, or residual porosity. By catching these issues early, you avoid wasting furnace time and material on a flawed batch.
Optimizing Thermal Schedules with Structural Feedback
Post‑sintering XRD turns the furnace into a feedback‑controlled system. By quenching samples at different hold times and temperatures, you can track the evolution of the tetragonal‑to‑cubic phase ratio in partially stabilized zirconia or measure the disappearance of monoclinic Baddeleyite.
If the target application requires a fully cubic microstructure, XRD data tells you at what temperature the last monoclinic or tetragonal fraction vanishes. Similarly, if a small amount of a secondary phase like yttria or pyrochlore appears at the highest temperatures, you can scale back the peak soak slightly to avoid it. This iterative loop ensures the final component attains the desired phase constitution and, consequently, the expected mechanical or thermal properties.
Understanding the Trade‑offs and Pitfalls
Detection Limits and the Blind Spot for Amorphous Phases
Standard XRD struggles to quantify amorphous material unless an internal standard method is applied. A sample with 15% glassy phase may look perfectly clean in a qualitative scan. If you blindly rely on Rietveld refinement without specifying an amorphous fraction, the reported crystalline phase percentages will be normalized to 100% and thus systematically overestimated.
Furthermore, the 0.1–1 wt% detection limit means that trace impurities—sometimes enough to nucleate catastrophic grain‑boundary phases—can go unnoticed. When such traces matter, complementary techniques like electron microscopy become necessary.
Overlapping Peaks in Complex Solid Solutions
Heavily doped ceramics often show severe peak broadening and overlap. The cubic and tetragonal reflections of YSZ differ by only a few hundredths of a degree in 2θ. Without good starting structural models and high‑quality data, Rietveld refinement can converge on a wrong local minimum or swap the phase assignments.
Additionally, compositionally inhomogeneous samples can yield asymmetric peaks, making accurate lattice parameter determination difficult. Using a slow scan rate over a narrow 2θ range often improves resolution enough to separate contributions, but it extends measurement time substantially.
Microstructural Effects on Peak Position and Width
The instrument is not the only source of peak broadening. Nanometer‑sized crystallites broaden peaks via the Scherrer effect, while non‑uniform strain in the lattice creates angle‑dependent broadening. Both effects can shift the apparent peak centroid, leading to errors in the refined lattice parameter.
To isolate the true structural signal, you must correct for instrumental broadening using a line‑profile standard. For more detailed analysis, a Williamson‑Hall plot can separate size and strain contributions, giving you a more accurate lattice constant and insight into the residual stresses from sintering.
Making the Right Choice for Your Analysis Goal
How you employ XRD depends entirely on whether you are optimizing the doping level, validating a thermal schedule, or performing rapid QA on sintered parts.
- If your primary focus is confirming dopant incorporation into the host lattice: Use high‑resolution scans across a few key reflections. Track the refined lattice parameter as a function of dopant composition; a systematic shift indicates a true solid solution, while a plateau flags the solubility limit.
- If your primary focus is monitoring phase purity and transformation sequences: Invest in full‑pattern Rietveld refinement. Quantify cubic, tetragonal, and monoclinic ZrO₂ fractions, and explicitly search for trace secondary phases like unreacted yttria or pyrochlore.
- If your primary focus is rapid, routine quality control of sintered components: Adopt the internal standard method. Blend in a known amount of a simple standard, run a fast scan, and measure a single peak‑intensity ratio to verify that the phase composition has not drifted outside specification.
- If your primary focus is linking furnace parameters directly to microstructural outcomes: Combine time‑resolved XRD with thermal history logs. Map lattice parameter and phase fraction changes against hold time and temperature to build a phase‑stability diagram that guides soak‑time optimization and atmosphere control.
By matching the XRD technique to the specific question at hand, you turn a lab furnace from a simple heating device into a precision instrument for designing ceramic microstructures with confidence.
Summary Table:
| Analysis Goal | XRD Technique / Method | Key Structural Insights & Value |
|---|---|---|
| Dopant Incorporation | Bragg's Law & Unit Cell Indexing | Confirms solid-solution formation & solubility limits via peak shifts |
| Phase Quantification | Rietveld Refinement (Full-Pattern) | Accurately quantifies polymorphs (cubic, tetragonal) down to 0.1–1 wt% |
| Amorphous & Fast QA | Internal Standard Method | Determines true crystalline content; ideal for rapid process control |
| Furnace Optimization | Thermal Schedule Tracking | Maps phase evolution against soak time/temp to refine sintering cycles |
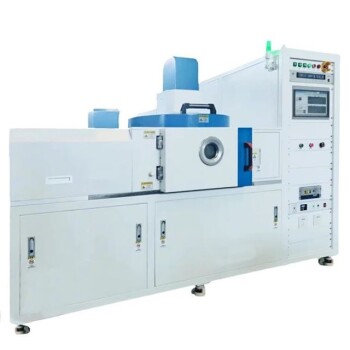
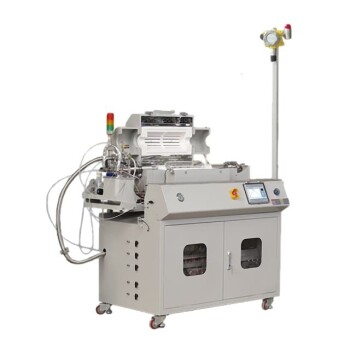
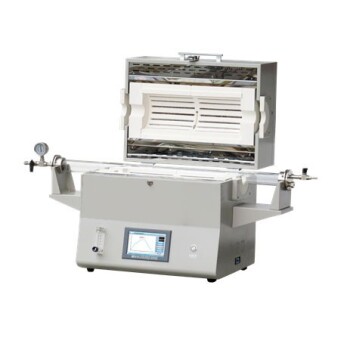
Ready to achieve precise phase purity and optimal microstructure in your ceramic research? KINTEK offers a comprehensive range of advanced high-temperature laboratory furnaces—including muffle, tube, vacuum, atmosphere, rotary, and CVD systems—all customizable to meet your exact sintering and material synthesis requirements. Optimize your thermal processing and structural outcomes today—contact KINTEK for custom furnace solutions!
Related Products
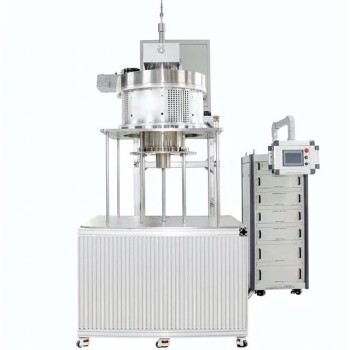
- 915MHz MPCVD Diamond Machine Microwave Plasma Chemical Vapor Deposition System Reactor
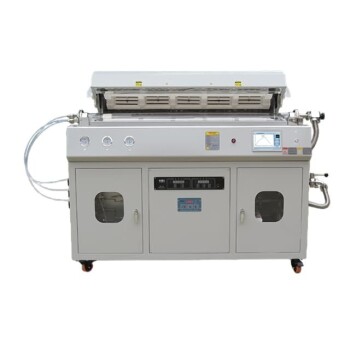
- Multi Heating Zones CVD Tube Furnace Machine for Chemical Vapor Deposition Equipment
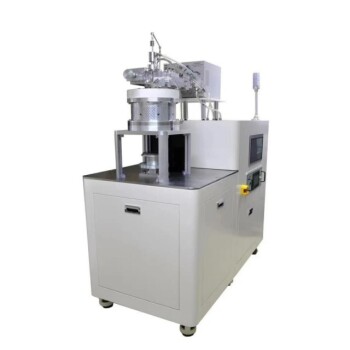
- MPCVD Machine System Reactor Bell-jar Resonator for Lab and Diamond Growth
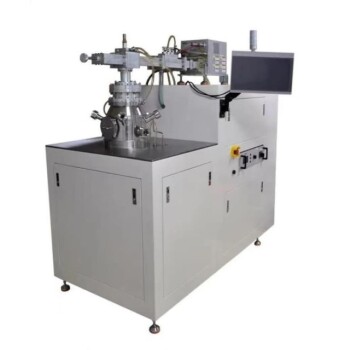
- Cylindrical Resonator MPCVD Machine System for Lab Diamond Growth
- High Temperature Muffle Oven Furnace for Laboratory Debinding and Pre Sintering
People Also Ask
- What is the MPCVD method and why is it considered effective for diamond deposition? Superior Purity & High Growth Rates
- What factors influence the quality of diamond deposition in the MPCVD method? Master the Critical Parameters for High-Quality Diamond Growth
- What are some key features and benefits of the microwave plasma chemical vapor deposition system? Achieve Unmatched Material Synthesis
- What is the purpose of a microwave plasma chemical vapor deposition system? Grow High-Purity Diamonds and Advanced Materials
- What is the basic principle of operation for the microwave plasma chemical vapor deposition system? Unlock High-Purity Material Growth