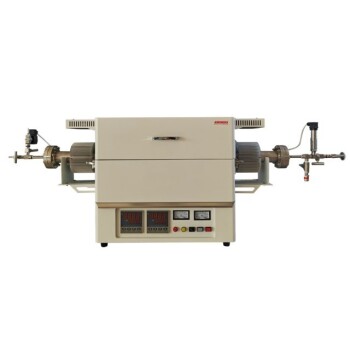
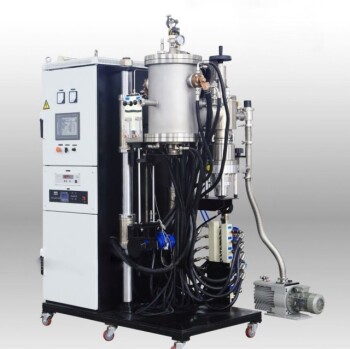
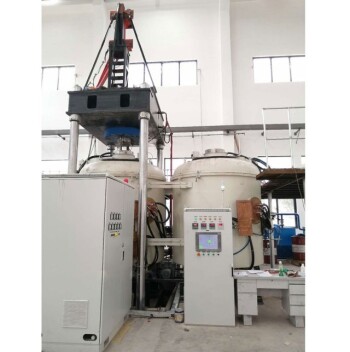
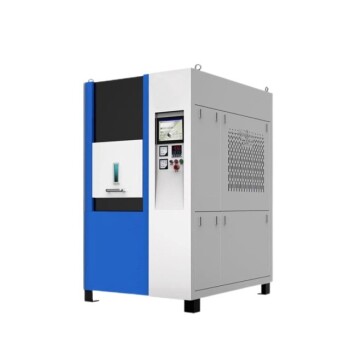
Sintering diagrams are your strategic roadmap for turning raw powder into a dense, high-performance component. By reading the boundaries between diffusion mechanisms and following the superimposed time contours, you can identify the precise temperature window and hold duration that drives densification while avoiding wasted energy. This theoretical framework directly informs the ramp rates, peak temperatures, and soak times you program into a high-temperature laboratory furnace—but it must be tuned to your specific powder’s quirks.
Sintering diagrams let you pinpoint the thermal regime where grain boundary diffusion outcompetes surface diffusion, giving you a high-efficiency densification path. Their genuine power comes from using them as a launchpad for empirical refinement, not as a rigid recipe.
Decoding the Axes: What a Sintering Diagram Tells You
A sintering diagram plots your material’s structural evolution against two dimensionless variables, instantly revealing the dominant atomic transport mechanism at any processing point.
Homologous Temperature (T/Tₘ) as the Universal Scale
The x-axis is homologous temperature—the actual temperature divided by the material’s melting point in Kelvin.
This normalizes the thermal driving force across entirely different ceramic or metallic systems.
When you see a mechanism boundary shift, you are seeing the point where thermal energy activates a new diffusion pathway.
Normalized Neck Radius or Relative Density as the Progress Tracker
The y-axis represents how far sintering has advanced, either as the neck radius between particles divided by particle radius or as relative density.
Early on, the diagram tracks neck growth; later, it maps bulk densification.
This axis lets you connect your furnace program’s target density to a specific point on the diagram, aligning your heating profile with the required atomic-scale evolution.
Mechanism Fields: The Dominant Transport Pathways
The diagram is divided into fields, each dominated by a single mass transport mechanism: surface diffusion, grain boundary diffusion, or lattice (volume) diffusion.
Surface diffusion grows necks without densification—it’s a low-temperature trap that consumes your thermal budget.
Grain boundary diffusion and lattice diffusion pull atoms from the grain interior into the neck, causing shrinkage and true densification.
Your goal is to design a thermal schedule that quickly passes through surface-diffusion-dominated regions and spends the bulk of its time where densifying mechanisms rule.
From Diagram to Furnace Program: Translating Theory into a Thermal Recipe
You don’t need to guess; the diagram gives you concrete numbers that translate directly to your furnace’s controller.
Identifying the Target Mechanism Window
Look for the field where grain boundary diffusion dominates at the density level you need to achieve.
For many ceramics and metals, this sits in a homologous temperature range of roughly 0.5 to 0.8 T/Tₘ.
Pinpoint the exact temperature that places your process inside that field, and set your furnace’s peak soak temperature there—not higher, which risks grain coarsening.
Using Time Contours to Define Hold Durations
Superimposed contours of constant sintering time show how long it takes to reach a given neck radius or density at a specific temperature.
If your target density lies on the “10-hour” contour at 0.7 T/Tₘ, you know your soak time must be at least that long—and can avoid blindly extending it.
This eliminates the trial‑and‑error “soak and pray” approach, slashing energy consumption and furnace occupancy.
Designing Ramp Rates to Cross Boundaries Effectively
You don’t want to linger in the surface-diffusion field, where time is wasted on non‑densifying neck growth.
Program a fast ramp through the low‑temperature region up to the densifying window, then slow down only where the curve demands precise thermal activation.
Once inside the grain boundary diffusion field, a moderate ramp to the final soak temperature prevents thermal overshoot while staying within the mechanism’s sweet spot.
The Limitations That Demand Empirical Refinement
A sintering diagram is a theoretical construct built on idealized powder particles and pure material constants. Your lab powder is neither.
Extreme Sensitivity to Diffusion Coefficients and Surface Energy
The boundaries between mechanism fields shift noticeably when the material’s diffusion coefficients or surface energy deviate from the idealized values used to generate the diagram.
Even sub‑percent levels of impurities can accelerate or poison boundary diffusion, altering the optimal temperature window by tens of degrees.
Particle Size and Shape Destroy the Ideal Spherical Model
Real powders have a distribution of particle sizes and irregular shapes, while diagrams assume perfect, monosized spheres.
Smaller particles activate surface diffusion at lower temperatures, shifting mechanism boundaries and time contours in ways the diagram cannot predict.
You must validate any diagram‑derived program with your actual powder lot.
The Vital Role of Complementary Thermal Analysis
Differential thermal analysis (DTA/DSC) pinpoints exothermic reactions and phase transitions that your diagram ignores—like binder burnout or liquid formation.
Thermogravimetric analysis (TGA) tells you exactly where mass loss occurs, preventing rushing through critical outgassing stages.
A dilatometer run on your compact provides the direct shrinkage data needed to build a Master Sintering Curve, which acts as a far more precise, material‑specific sibling to the theoretical diagram.
Common Pitfalls When Applying Sintering Diagrams to Furnace Programming
Even an accurate diagram can lead you astray if you ignore its underlying assumptions and the furnace’s real environment.
Over‑Emphasizing a Single Mechanism Map Without Material‑Specific Data
Plugging a generic diagram for a stoichiometric oxide into a furnace program for your doped, slightly off‑stoichiometry powder is a major risk.
Always start by benchmarking the diagram with a few isothermal holds on your actual powder, measuring density and grain size to confirm you’re in the intended mechanism field.
Neglecting Atmosphere Interactions
Diagrams rarely account for gas‑solid reactions like carbothermal reduction or nitridation that change surface chemistry and diffusion rates.
Couple your sintering program with effluent gas analysis (mass spectroscopy or FTIR) to ensure that off‑gassing events don’t create internal porosity or shift the dominant transport mechanism away from densification.
Confusing Heat‑up Strategy with Soak Strategy
A fast ramp through low temperatures is good, but if you heat so aggressively that the sample’s thermal lag creates a large core‑to‑surface gradient, you risk cracking.
Balance diagram‑inspired ramp rates with the thermal mass of your furnace and the sample’s thermal conductivity—the diagram shows where to go fast, your thermocouple tells you how fast you can physically go.
Making the Right Choice for Your Lab’s Goal
Your specific sintering objective dictates how aggressively you apply the diagram’s insights.
- If your primary focus is maximizing density without grain growth: Target the exact temperature‑time coordinate where grain boundary diffusion dominates, and keep the soak exactly on the required time contour—no longer.
- If your primary focus is screening novel powder compositions quickly: Use the diagram to estimate a plausible densification window, then run a set of constant-heating-rate dilatometry profiles to construct a Master Sintering Curve for predictive design.
- If your primary focus is energy efficiency and furnace throughput: Exploit the diagram’s time contours to eliminate excessive holds, and consider dynamic thermal cycling around the phase-transformation temperature to accelerate early‑stage diffusion via surplus vacancy generation.
A sintering diagram doesn’t replace your expertise—it amplifies it, turning your laboratory furnace into a precision densification tool that obeys physics rather than habit.
Summary Table:
| Diagram Element | Physical Mechanism | Thermal Schedule Action |
|---|---|---|
| Homologous Temp ($T/T_m$) | Identifies active atomic diffusion pathways | Sets peak soak temperature (typically $0.5\text{--}0.8 T/T_m$) |
| Surface Diffusion Field | Neck growth without densification (wasted heat) | Fast ramp rates to pass through quickly |
| Grain Boundary Diffusion | Mass transport driving true shrinkage & density | Precise soak window to maximize densification |
| Time Contours | Duration needed to reach target density | Defines exact hold duration to prevent grain growth |
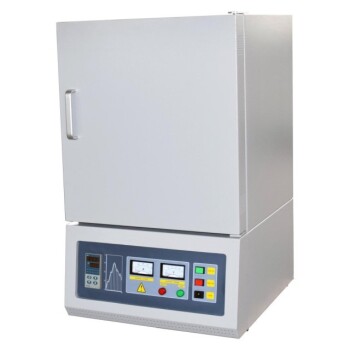
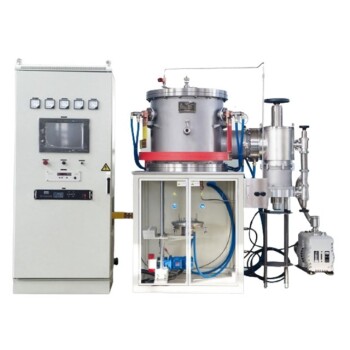
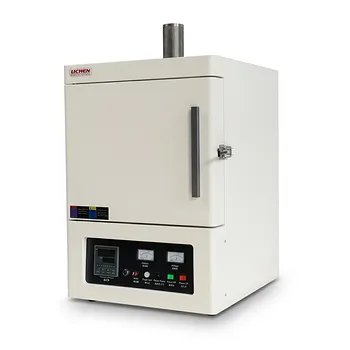
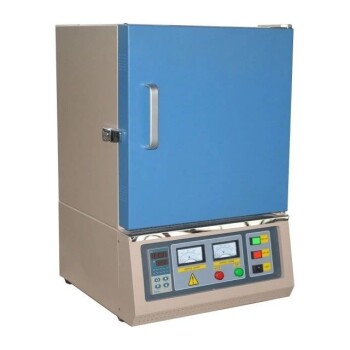
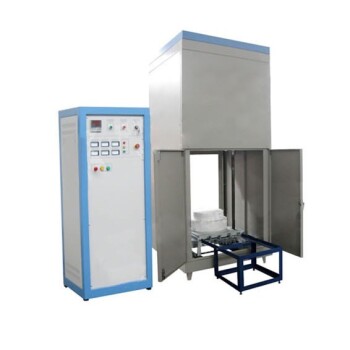
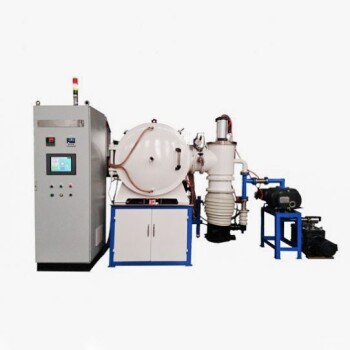
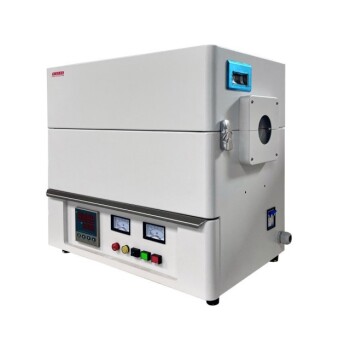
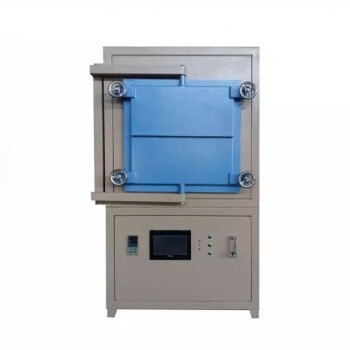
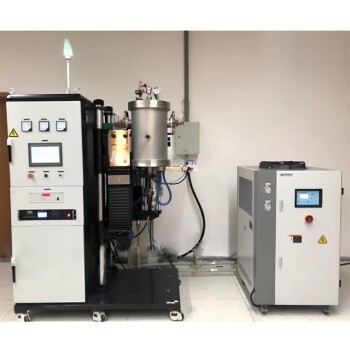
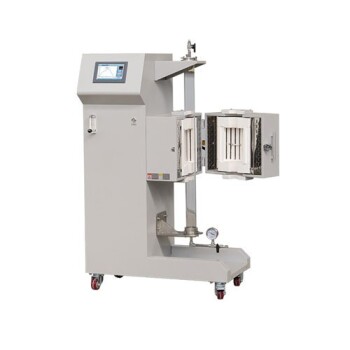
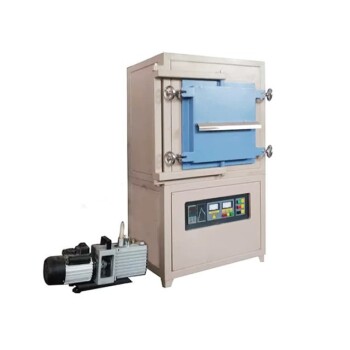
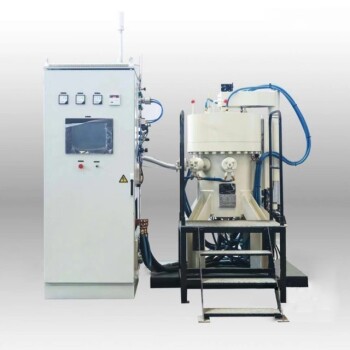
Ready to translate your theoretical sintering models into repeatable, high-density results? KINTEK offers a comprehensive range of fully customizable, high-temperature laboratory furnaces—including muffle, tube, vacuum, atmosphere, CVD, and rotary systems—engineered for unmatched thermal uniformity and precise atmosphere control.
Whether you are refining ceramic densification profiles or developing novel metallic alloys, our equipment provides the stability and control your advanced research demands. Contact KINTEK today to discuss your specific thermal processing needs with our lab equipment experts!
Related Products
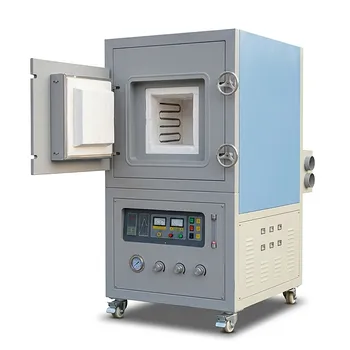
- High Temperature Muffle Oven Furnace for Laboratory Debinding and Pre Sintering
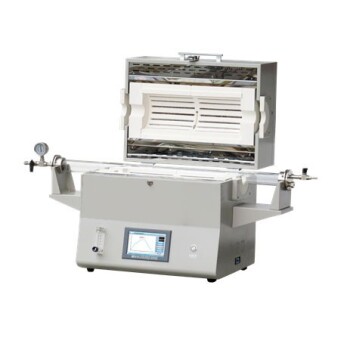
- 1400℃ High Temperature Laboratory Tube Furnace with Alumina Tube
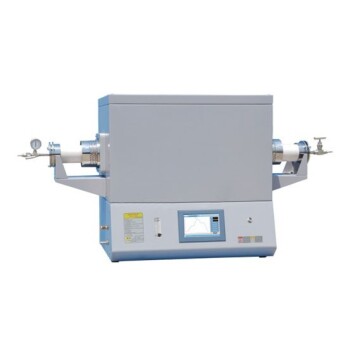
- 1700℃ High Temperature Laboratory Tube Furnace with Alumina Tube
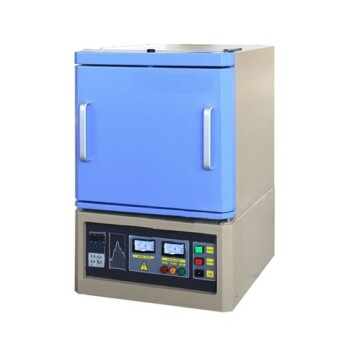
- 1800℃ High Temperature Muffle Oven Furnace for Laboratory
- 1700℃ High Temperature Muffle Oven Furnace for Laboratory
People Also Ask
- What thermal phenomena occur during polymer binder burnout in ceramic green bodies? Lab Furnace Guide
- Why is controlled heat treatment in a muffle furnace necessary for calcined clay? Achieve Optimal Pozzolanic Activity
- What role does a high-temperature muffle furnace play in STFO synthesis? Achieve Pure Perovskite Results
- How does a high-temperature muffle furnace facilitate the formation of LaNbxAl1−xO3+δ perovskite structures? Key Roles
- What role does a high-temperature muffle furnace play in the multi-stage synthesis of Li0.5MnFe1.5O4? Key to Pure Spinel