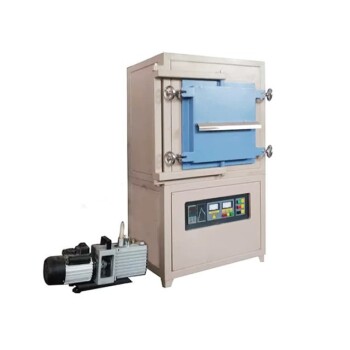
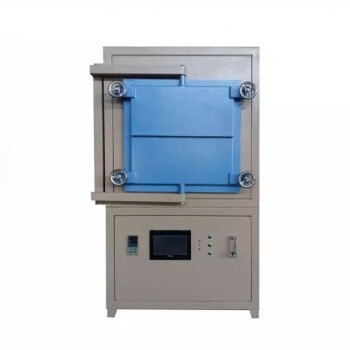
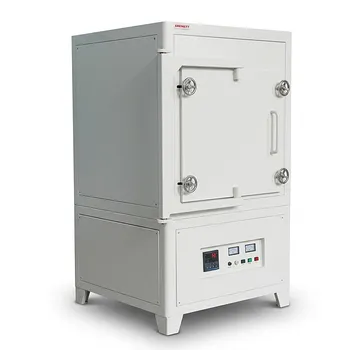
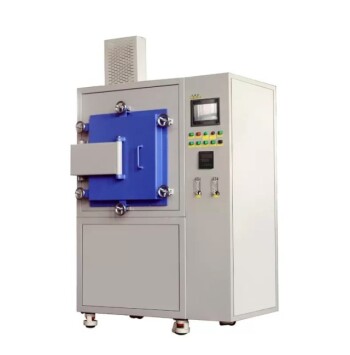
Real-time dilatometric analysis transforms guesswork into precision. By continuously tracking linear shrinkage as modified PZT compacts heat up in a controlled-atmosphere furnace, researchers can watch densification happen second by second. This live data reveals the exact temperatures where rapid shrinkage kicks in, how fast it occurs, and when it stops. With that insight, engineers directly fine-tune the heating ramp, the hold temperature, and the gas environment to lock in maximum density while sidestepping grain overgrowth, cracking, or volatile lead loss.
The core insight: a single real-time shrinkage curve replaces weeks of trial-and-error sintering. It uncovers the material’s densification fingerprint—showing you not just when to act, but exactly what atmosphere and thermal path will push modified PZT to near-theoretical density without sacrificing microstructure.
Understanding the Sintering Challenge in Modified PZT
Doping PZT with ions like Nb⁵⁺, Ba²⁺, or Sr²⁺ intentionally alters vacancy chemistry and mass transport pathways. These changes accelerate densification but also shift the temperature window where it happens. Without real-time feedback, you risk overshooting the ideal profile and introducing defects.
Sintering is not a single “bake” event. It is a sequence of surface diffusion, grain‑boundary migration, and pore elimination. Each stage depends on heating rate, peak temperature, and atmospheric composition. Modified PZT adds complexity because the dopant-created lead vacancies can either speed up densification or trigger abnormal grain growth if the thermal cycle isn’t tightly controlled.
The fine line between full density and failure is often only 20–50 °C wide. Traditional trial-and-error methods miss this dynamic window, leading to under‑fired bodies or bloated, lead‑depleted microstructures.
How Real-Time Dilatometry Reveals the Densification Fingerprint
A high‑temperature dilatometer inside a controlled‑atmosphere furnace uses a push‑rod and an LVDT (Linear Variable Displacement Transducer) to measure the compact’s length change ((\Delta L/L_0)) as temperature ramps up. The system continuously records relative shrinkage and the instantaneous shrinkage rate.
The resulting curve is a direct map of densification kinetics. Unlike post‑mortem density measurements, this real‑time trace shows when the first particles start to fuse, when bulk densification peaks, and when shrinkage stops because the pores have closed or trapped gas.
Pinpointing the Onset and Peak of Densification
The dilatometric trace spells out the exact onset temperature of shrinkage. In Nb‑doped PZT, for example, this often occurs sharply around 800 °C, where the shrinkage rate spikes as dopant‑induced lead vacancies accelerate mass transport.
The maximum shrinkage rate temperature gives you the target hold zone. Holding the furnace just above this peak lets densification complete without pushing the temperature into a regime where grain boundaries tear away from pores (over‑firing). The curve also exposes any multi‑stage densification caused by heterogeneous dopant distribution or phase transitions, so you can insert intermediate holds or adjust the ramp rate accordingly.
Tailoring Heating Ramps and Hold Times
With the shrinkage rate curve in hand, you can set heating ramps that match the material’s actual needs, not a generic profile. Before the onset temperature, you can use a faster ramp to save time. Right at the steep rise in shrinkage, a reduced heating rate gives diffusion enough time to eliminate pores without creating internal stress.
Holding at the temperature that captures 95–98 % of total shrinkage squeezes out residual porosity while minimizing grain coarsening. The dilatometer confirms the hold is effective because shrinkage plateaus in real time. If you stop the hold too early, the curve drifts upward; too late, and you risk entering a regime of PbO loss and grain‑growth‑induced weakening.
Controlling Atmosphere to Prevent Lead Loss and Stabilize Densification
Modified PZT is notorious for PbO volatilization above 1000 °C. A controlled atmosphere—typically synthetic air, or inert gases like argon—suppresses this loss. Real‑time dilatometry in an atmosphere furnace shows exactly how the gas environment affects shrinkage.
Comparing profiles run in different atmospheres reveals mass transport mechanisms. For instance, a shift toward higher onset temperatures under argon might indicate that a reducing environment suppresses oxide‑vacancy formation. With this data, you can program gas switching intervals—for example, switching from air to a PbO‑rich carrier gas at a critical temperature—to maintain stoichiometry while still achieving full density.
Accounting for Dopant Effects on Shrinkage Behavior
Different dopants fundamentally rewrite the shrinkage curve. Donor dopants like Nb⁵⁺ create A‑site vacancies that act as ultra‑fast diffusion highways, lowering the densification temperature and sharpening the shrinkage rate peak. In contrast, isovalent dopants like Ba²⁺ or Sr²⁺ can shift the maximum shrinkage rate to higher temperatures by modifying the liquid‑phase formation and surface reactivity.
Real‑time dilatometry catches these shifts immediately. A spike in shrinkage at 780 °C for Nb‑doped PZT versus a gradual rise starting at 850 °C for a Ba‑doped variant tells you that the two materials need completely different heating strategies—even if their target densities are the same.
Understanding the Trade‑offs and Pitfalls
Real‑time dilatometry is powerful, but it comes with limitations that must be respected to avoid misleading conclusions.
The shrinkage curve is an indirect density gauge. It assumes isotropic shrinkage and a uniform green density. Anisotropic particle orientation or binder burnout artifacts can distort the true densification rate. You must always cross‑validate with post‑sinter density measurements.
Lead‑rich atmospheres can foul the push‑rod. In PZT systems, condensing PbO can stick to the measurement train, causing drift. A stable, pre‑conditioned furnace environment and regular cleaning protocols are essential to preserve the accuracy of (\Delta L/L_0) data.
Fast ramps may hide microstructural damage. While the shrinkage rate might look ideal, a rapid ramp could still generate thermal gradients that lead to cracking. Dilatometry gives the macroscopic average; it cannot directly reveal internal stress distributions. Complementary techniques like acoustic emission monitoring or post‑sinter microscopy are often needed.
Atmosphere‑dependent artifacts exist. Some gas environments can react with the push‑rod material or alter the surface energy of the sample without changing bulk densification. Always verify that the observed shrinkage shift is truly a material effect and not an instrument‑gas interaction.
Making the Right Choice for Your Goal
Real‑time dilatometric analysis is not a one‑size‑fits‑all recipe; it’s a decision‑making tool. How you use it depends on what you’re optimizing for.
- If your primary focus is achieving maximum density ((>98%)): Use the shrinkage rate peak to set a multi‑step hold program—first targeting the steepest densification zone, then a short final hold at a temperature that captures the last 2 % of shrinkage without overshooting into lead‑loss territory.
- If your primary focus is tight microstructural control (grain size, phase purity): Run comparison dilatometry runs under different atmospheres (air vs. inert) to isolate surface diffusion from bulk diffusion. Then choose the gas environment that promotes densification while delaying grain growth until pores are fully eliminated.
- If your primary focus is process reproducibility and scale‑up: Build a master shrinkage curve for your specific powder lot, and program your controlled‑atmosphere furnace to follow that exact thermal path. Use the real‑time signal as a process monitor—if the shrinkage deviates from the master curve, flag the batch.
- If your primary focus is tailoring piezoelectric performance (e.g., d₃₃): Remember that full density is only part of the story. Dilatometry can help you find a profile that delivers 99 % density, as achieved in some optimized PZT cycles yielding d₃₃ up to 270 pC/N, but always correlate the shrinkage data with electrical testing to confirm that the sintering path preserves the required domain structure.
Knowledge of your material’s precise densification fingerprint lets you move from hoping for a good result to engineering it with full confidence.
Summary Table:
| Optimization Focus | Key Dilatometric Insight | Furnace & Atmosphere Strategy |
|---|---|---|
| Onset & Peak Shrinkage | Pinpoints exact start (~800 °C) and peak shrinkage rate | Adjust ramp rates and set hold temp just above peak rate |
| Lead (PbO) Volatilization | Tracks shrinkage rate changes caused by gas interaction above 1000 °C | Apply controlled atmosphere (air/carrier gas) to suppress lead loss |
| Dopant Chemistry (Nb, Ba, Sr) | Detects shifts in mass transport and densification windows | Tailor unique thermal profiles based on donor/isovalent dopant shifts |
| Microstructure & Density | Identifies real-time plateau indicating 95–98% shrinkage completion | Stop hold precisely to maximize density without abnormal grain growth |
Master Your Advanced Ceramic Sintering with KINTEK
Precision heat treatment requires total control over thermal paths and atmospheric conditions. KINTEK specializes in high-performance laboratory equipment and consumables, offering a comprehensive range of high-temperature furnaces—including atmosphere, vacuum, tube, muffle, rotary, CVD, dental, and induction melting furnaces—all fully customizable to meet your specific research and production requirements.
Ready to eliminate guesswork and achieve near-theoretical material density? Contact KINTEK today to consult with our thermal processing experts and design your tailored furnace solution!
Related Products
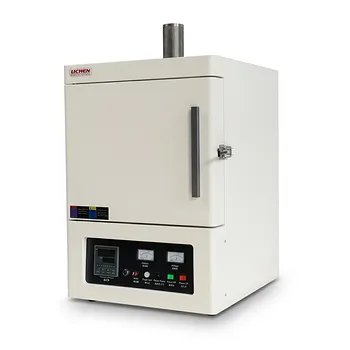
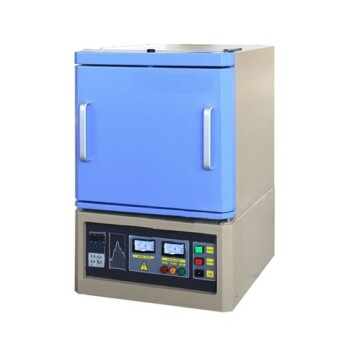
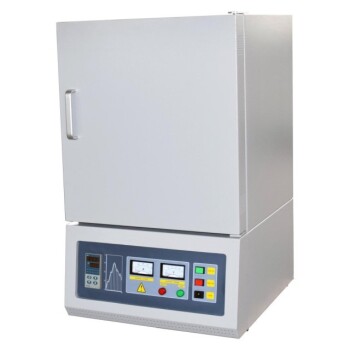
- 1700℃ Controlled Inert Nitrogen Atmosphere Furnace
- 1400℃ Controlled Inert Nitrogen Atmosphere Furnace
- 1200℃ Controlled Inert Nitrogen Atmosphere Furnace
- Controlled Inert Nitrogen Hydrogen Atmosphere Furnace
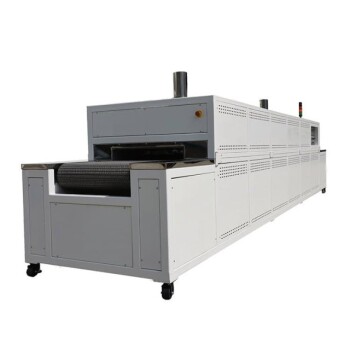
- Mesh Belt Controlled Atmosphere Furnace Inert Nitrogen Atmosphere Furnace
People Also Ask
- How do controlled-atmosphere furnaces support polymer pyrolysis? Master SiC & Si3N4 Ceramic Conversion
- How do controlled-atmosphere furnaces verify ceramic powder sinterability? Get True Empirical Densification Data
- Why are controlled atmosphere high-temperature furnaces essential for the post-treatment annealing of oxide ceramic powders?
- What role does a high-temperature inert atmosphere furnace play in carbonization? Optimize Your Carbon Yield
- Why is an atmosphere-controlled furnace necessary for NMC811 synthesis? Optimize Battery Capacity & Structure