Understanding how materials densify is the key to selecting the right furnace temperature. Sintering mechanism maps, also known as Ashby diagrams, directly guide temperature selection by visually identifying the thermal window where densifying mechanisms like grain boundary diffusion dominate over non-densifying ones like surface diffusion. They allow you to choose a furnace setpoint not by trial-and-error, but by seeing exactly where atomic transport pathways shift to eliminate porosity.
The core challenge in sintering isn't just applying heat; it's applying the right heat to activate the correct atomic mechanisms. A sintering diagram is a strategic map for navigating this. It answers not just "what temperature to use," but "how to design a thermal profile that intentionally bypasses low-temperature, non-densifying mechanisms to achieve full densification in a high-temperature laboratory furnace."
The Strategic Logic of a Sintering Diagram
An Ashby diagram isn't a simple recipe. It is a predictive field map that plots the competition between different mass transport pathways. The genius of the tool is that it frames this competition against two variables you control.
Mapping the Battlefield of Atomic Transport
The axes of a classic Ashby diagram are homologous temperature ($T/T_M$) and neck radius (a proxy for density or time). Within this field, the diagram identifies the dominant mechanism—the one that moves the most material at any given moment.
Non-densifying mechanisms, like surface diffusion, dominate at low temperatures. They coarsen the powder compact by growing necks between particles, but they do not bring particle centers closer together.
Densifying mechanisms, such as grain boundary and lattice diffusion, dominate at higher temperatures. These pathways transport material from the grain boundary (a source) to the neck surface (a sink), allowing particles to collapse into each other and shrink the pore volume.
Avoid the Surface Diffusion Trap
The primary strategic insight from a sintering diagram is the urgent need to bypass the field of surface diffusion. Spending too long in a low-temperature regime is a common pitfall.
Surface diffusion creates strong, well-developed necks early on, but it stabilizes a pore network that is difficult to eliminate later. This process consumes the driving force for densification without delivering any shrinkage. The diagram defines the danger zone. A rapid heating rate through low-temperature regimes ensures your material spends minimal time in the non-densifying field, preserving the thermodynamic driving force for shrinkage where it is most effective.
Using Diagrams to Define the Ideal Thermal Window
A laboratory high-temperature furnace is the precision instrument for executing the strategy the diagram reveals. The diagrams don't just predict a random point; they identify a specific regime for process control.
Pinpointing the Densification Regime
By tracing a vertical path up on the diagram (representing a heating ramp), you can see the exact homologous temperature at which the mechanism boundary crosses from surface diffusion to grain boundary diffusion.
This crossing point defines your minimum target temperature for densification. The diagram further shows how time contours run through that regime, helping you select a dwell temperature and hold time where densification is predicted to be the fastest and most dominant process.
Translating Theory into Furnace Parameters
The precision of a modern lab furnace is what brings the theoretical map to life. The diagram's guidance translates into a specific thermal profile.
A furnace with high thermal stability and excellent zone uniformity is not a luxury; it's a requirement to ensure the entire component experiences the target thermodynamic conditions. A programmable controller allows you to execute the critical fast ramp through the low-temperature fields and then a precise, stable dwell directly in the densifying regime. Any deviation can inadvertently drop the process back into a non-densifying field and stall pore removal.
Engineering the Initial-Stage Kinetic Boost
Sintering kinetics, particularly the diffusivity ($D$), have an exponential dependence on temperature. A small, precise temperature increase has a massive effect on atom mobility.
Ashby diagrams account for this directly by using homologous temperature. The diagram confirms that the greatest kinetic return on a small temperature increment occurs at the boundary between non-densifying and densifying mechanisms. A laboratory furnace allows you to exploit this sensitive exponential relationship and hit the exact temperature needed to maximize this rapid acceleration.
Understanding the Trade-offs and Limitations
A trustworthy guide must also acknowledge the limitations of the map. Blindly trusting a theoretical diagram without empirical context is a path to process failure.
The Material Constant Problem
An Ashby diagram is plotted using specific material constants: diffusion coefficients, surface energy, and particle size. Any variation in your actual powder purity, chemistry, or particle size distribution will shift the mechanism boundaries.
A minor impurity can dramatically alter grain boundary diffusivity, while a different particle size changes the initial neck radius. The diagram provides an invaluable starting framework, but the final thermal profile must be empirically refined for your specific ceramic or metallic formulation.
The Risk of Runaway Grain Growth
Pursuing full density by simply maximizing temperature can overshoot the goal. A final-stage sintering risk that diagrams often don't capture is the separation of pores from grain boundaries during rapid grain growth.
Once pores become isolated inside grains, they can no longer be eliminated by grain boundary diffusion. The result is a large grain size with locked-in residual porosity. Your process must use the diagram to achieve densification without crossing into a regime of uncontrolled, high-temperature grain growth that undermines final microstructural quality.
Making the Right Choice for Your Goal
An Ashby diagram is your process design compass. Use it to define the strategic goal, then configure your lab furnace to execute it with precision.
- If your primary focus is maximizing density: Use the diagram to identify the lowest temperature regime where grain boundary diffusion is dominant. Set a high ramp rate to bypass the surface diffusion field, and then a stable dwell in this regime to efficiently shrink pores without coarsening the grain structure.
- If your primary focus is microstructural control: Use the diagram to understand the competition between all mechanisms. Design a two-step profile that first rapidly densifies and then lowers temperature to slow grain growth, balancing the driving forces for pore removal and boundary mobility.
The sintering diagram doesn't hand you the perfect answer; it gives you the power to ask the right questions. By visually defining the battlefield of atomic transport, it transforms temperature selection from guesswork into a logical, defensible strategy for achieving full densification.
Summary Table:
| Sintering Mechanism | Dominant Regime ($T/T_M$) | Microstructural Impact | Recommended Furnace Strategy |
|---|---|---|---|
| Surface Diffusion | Low Temperature | Non-densifying; coarsening and neck growth without shrinkage | Fast heating ramp to bypass non-densifying zone |
| Grain Boundary & Lattice Diffusion | High Temperature | Densifying; material transport reduces pore volume and shrinks compact | Stable dwell at pinpointed target temperature |
| Uncontrolled Grain Growth | Excessively High Temperature | Harmful; pores detach and become trapped inside grains | Precise temperature control and multi-step profile |
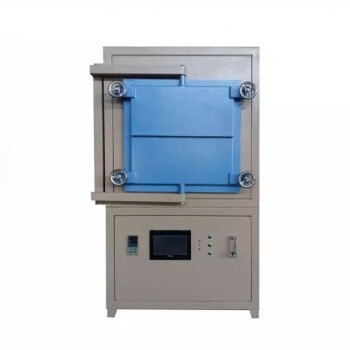
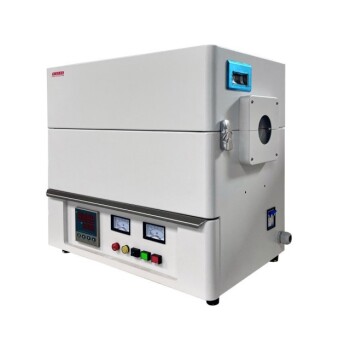
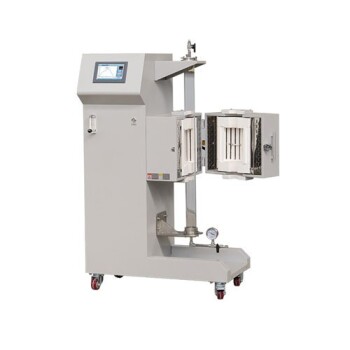
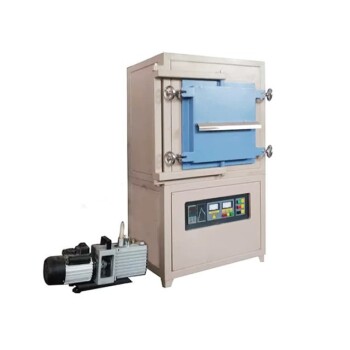
Ready to bring your sintering strategy to life with ultra-precise thermal control? KINTEK specializes in high-performance laboratory equipment and consumables, offering a comprehensive range of customizable high-temperature furnaces—including muffle, tube, rotary, vacuum, CVD, atmosphere, dental, and induction melting furnaces. Designed for high thermal stability and exact profile execution, our systems ensure your materials reach full densification every time.
Contact our heating technology experts today to optimize your lab setup!
Related Products
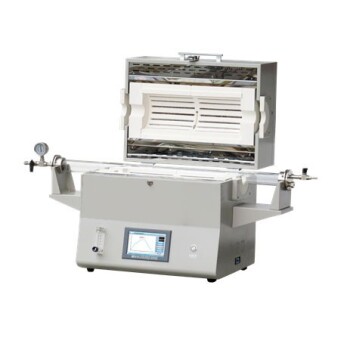
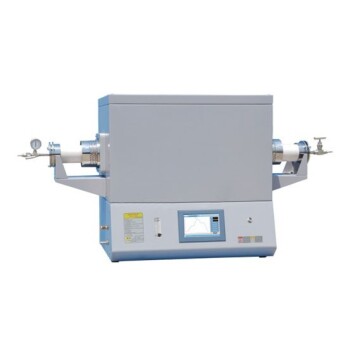
- 1400℃ High Temperature Laboratory Tube Furnace with Alumina Tube
- 1700℃ High Temperature Laboratory Tube Furnace with Alumina Tube
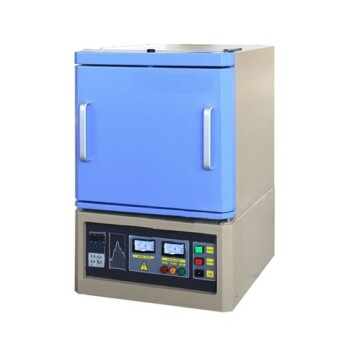
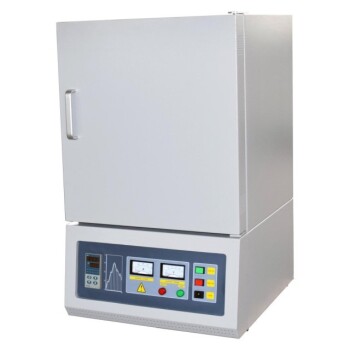
- 1800℃ High Temperature Muffle Oven Furnace for Laboratory
- 1700℃ High Temperature Muffle Oven Furnace for Laboratory
- 1200℃ Muffle Oven Furnace for Laboratory
People Also Ask
- How does zone-melting in tube furnaces synthesize bismuth micro-wires? Master Single-Crystal Thermoelectric Growth
- How are high-temp tube furnaces used to measure diffusion coefficients per Fick's law? Master Precision Annealing
- How are high-temperature laboratory tube furnaces applied in long-term vacuum homogenization heat treatments for intermetallic samples?
- How do high-temperature laboratory tube furnaces ensure environmental stability? Precision Thermal Reduction Tips
- How are high-temperature tube furnaces applied in testing ceramic-supported alloy membranes? Insights