Sintering kinetics are the blueprint for densification—and variable heating rates are the tool that reveals them. By operating a high-temperature laboratory furnace at multiple controlled heating rates (typically 1–20 K/min), researchers can continuously measure a powder compact’s linear shrinkage and extract both the activation energy and the kinetic time exponent that govern the sintering process. This non-isothermal approach shifts the temperature at which peak densification occurs, exposes the dominant mass transport mechanism, and ultimately enables engineers to design thermal profiles that achieve full density without wasted time or energy.
To extract sintering kinetics and activation energy, use a programmable high-temperature furnace to run at least three different heating rates while recording shrinkage. The shift in the peak shrinkage-rate temperature with heating rate directly yields the activation energy, and the shape of the shrinkage curve reveals whether grain boundary or volume diffusion controls densification. This method turns a simple dilatometry experiment into a complete kinetic model.
Why Variable Heating Rates Reveal Sintering Mechanisms
Measuring Shrinkage as a Function of Temperature
A high-temperature dilatometer continuously records the change in sample length during heating. By plotting shrinkage (dy) against temperature and then differentiating, you obtain the instantaneous shrinkage rate dy/dT.
The single most important observation from variable-rate experiments is this: as the heating rate increases, the temperature of the maximum shrinkage rate shifts to higher values, but the total integrated shrinkage area stays constant. This means the same amount of densification occurs regardless of the heating schedule—it simply unfolds over a different temperature window.
How Heating Rate Dictates the Dominant Diffusion Path
Sintering’s mass transport can follow several atomic pathways, each with a different dependence on temperature.
Surface diffusion dominates at low temperatures and contributes to neck growth without appreciable densification. In contrast, grain boundary diffusion and volume diffusion are responsible for the actual removal of pores and the shrinkage of the compact.
When you apply a slow heating rate, the compact spends a long time in the low-temperature regime, allowing surface diffusion to coarsen the microstructure—strengthening necks but wasting the driving force that could have been used for densification later. A faster heating rate bypasses this low-temperature coarsening window, quickly bringing the material into the temperature range where grain boundary and volume diffusion become active, preserving the sintering potential and achieving higher final density.
By running multiple heating rates—say 1, 5, and 20 K/min—you can deliberately toggle between these regimes and see exactly where the transition from one mechanism to another occurs.
Extracting Activation Energy and Kinetics from Variable-Rate Data
The Kissinger‑Like Method for Activation Energy
In a constant‑heating‑rate experiment, the peak shrinkage-rate temperature ( T_p ) is a function of the heating rate ( \beta ). For thermally activated processes, this shift obeys a relationship analogous to the Kissinger equation used in chemical kinetics:
[ \ln\left(\frac{\beta}{T_p^2}\right) = -\frac{Q}{R}\cdot\frac{1}{T_p} + \text{constant} ]
Here ( Q ) is the activation energy and ( R ) is the universal gas constant.
By plotting (\ln(\beta/T_p^2)) versus (1/T_p) for three or more heating rates, the slope gives (Q) directly—no assumption about the precise kinetic model is needed beyond a single‑step, Arrhenius‑controlled process.
Direct Activation Energy via the Dorn Step‑Change Method
A more model‑free alternative uses the Dorn method, which exploits a furnace’s ability to make an instantaneous temperature jump.
You run the experiment at temperature ( T_1 ) until the shrinkage rate stabilizes at ( V_1 ). Then the furnace rapidly steps to a higher temperature ( T_2 ) while the dilatometer records the new instantaneous shrinkage rate ( V_2 ) before the sample’s density or microstructure can change.
The activation energy is then calculated from:
[ Q = \frac{R \cdot T_1 \cdot T_2}{T_1 - T_2} \ln\left(\frac{V_1}{V_2}\right) ]
This technique requires a furnace with fast thermal response and precise PID control, but it provides a direct measurement of ( Q ) that is independent of the full thermal history.
Extracting the Time Exponent and Identifying the Diffusion Mechanism
Beyond activation energy, the shape of the shrinkage curve holds the kinetic time exponent ( n ). For isothermal sintering, densification often follows a power law:
[ \left(\frac{\Delta L}{L_0}\right) = K t^n ]
Under non‑isothermal conditions with a known heating rate, the same kinetic model can be fitted to the raw shrinkage data.
The value of ( n ) is a fingerprint of the dominant mass transport mechanism:
- n ≈ 0.4–0.5 typically indicates volume diffusion.
- n ≈ 0.31–0.33 points to grain boundary diffusion.
Multiple heating‑rate runs provide a family of curves, making it possible to check whether the same ( n ) and ( Q ) hold across the entire densification range or whether the mechanism changes as the pores shrink.
Practical Implementation in the Laboratory
Furnace and Measurement Requirements
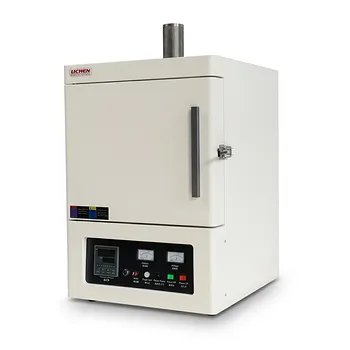
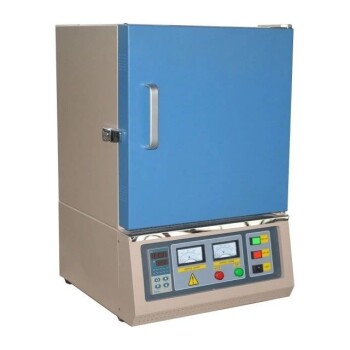
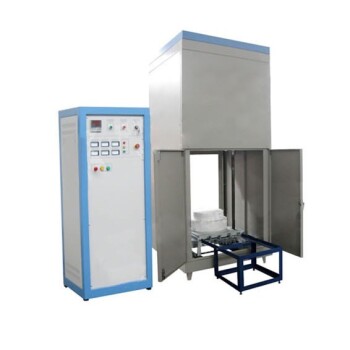
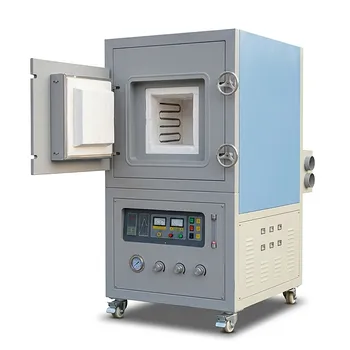
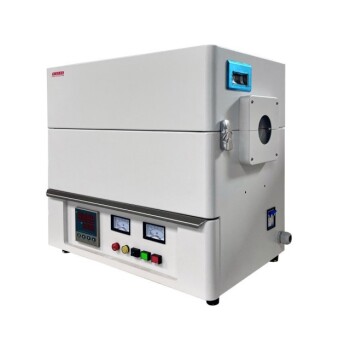
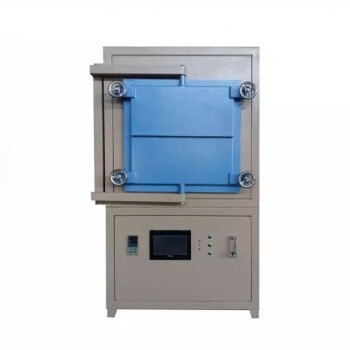
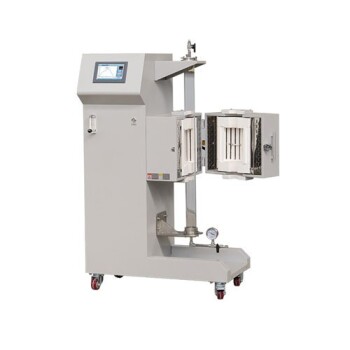
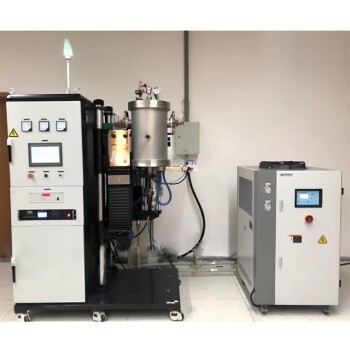
To execute these analyses, you need a high‑temperature laboratory furnace that delivers programmable multi‑segment heating ramps with tight temperature uniformity.
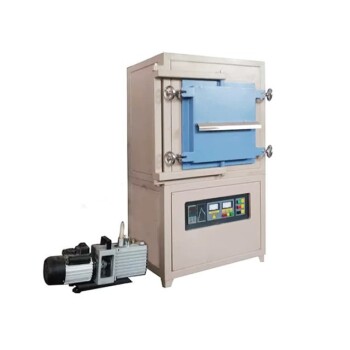
A controlled atmosphere (vacuum, inert gas, or reducing gas) is essential to prevent oxidation and ensure surface diffusion rates reflect the intrinsic material behaviour. The furnace must be paired with a high‑resolution dilatometer that continuously records length change without mechanical interference.
For the Dorn step‑change method, the furnace must also offer rapid thermal response—the ability to jump tens of degrees in seconds and stabilise immediately—so that you capture the instantaneous shrinkage rate before the microstructure evolves.
Step‑by‑Step Experimental Protocol
- Prepare identical green compacts of the metal powder, ensuring consistent density and geometry.
- Select at least three heating rates—for example, 1, 5, and 20 K/min—covering both the slow‑coarsening regime and the rapid‑densification regime.
- Run each compact separately while recording the dilatometer signal from room temperature to the isothermal sintering hold.
- Compute dy/dT from the raw shrinkage trace, identify the peak shrinkage‑rate temperature ( T_p ) for each rate, and verify that the integrated shrinkage area is constant across runs.
- Apply the Kissinger plot to obtain ( Q ). For validation, perform a Dorn jump on a separate sample.
- Fit the shrinkage curves to a kinetic law to extract the time exponent ( n ), and map the mechanism across the temperature window.
Using the Data to Optimise Thermal Profiles
Once you know ( Q ) and the dominant mechanism, you can design a rate‑controlled sintering (RCS) profile that bypasses surface‑diffusion coarsening but avoids overheating. For example, injection‑moulded 316L stainless steel reaches near‑full density, maximum hardness, and peak tensile strength at a heating rate of 10 °C/min; pushing to 15 °C/min introduces residual porosity because non‑uniform densification leaves large pores that act as stress concentrators, drastically reducing ductility.
Variable‑rate data lets you pinpoint that optimal window without trial‑and‑error.
Understanding the Trade‑offs
When Faster Is Not Better
Higher heating rates shift densification to higher temperatures and shorten the time available for pore removal. If the material’s thermal conductivity cannot keep up, temperature gradients develop across the part, causing non‑uniform shrinkage and trapped porosity.
The supplementary reference on 316L is a classic example: a mere 5 °C/min increase in ramp rate—from 10 to 15 °C/min—transforms a nearly fully dense, ductile component into a porous, brittle one. The furnace’s ability to hold a precise rate is just as important as the value of that rate.
Pitfalls in Interpreting Activation Energy
Sintering is rarely a single‑step reaction. The Kissinger‑style analysis assumes a constant activation energy and a single dominant mechanism, but early‑stage sintering may be controlled by surface diffusion while later stages shift to grain boundary or volume diffusion.
A single straight‑line Kissinger plot can be misleading if the mechanism changes with temperature. The Dorn method mitigates this by measuring ( Q ) at a specific density, but it still captures the activation energy of whatever mechanism is active at that moment. Always cross‑check the kinetic exponent ( n ) to confirm the mechanistic interpretation.
Finally, remember that the Arrhenius relation links diffusion coefficients to temperature: ( D_V = D_0 \exp(-Q/RT) ). A small error in furnace temperature measurement or in the assumption of isothermal conditions can propagate into a large error in ( Q ). Furnace calibration and hot‑zone uniformity are not trivial details—they are prerequisites for reliable kinetics.
How to Apply This to Your Project
- If your primary focus is to identify the dominant diffusion mechanism in your powder system: Run at least three heating rates, fit the shrinkage curves to extract the time exponent ( n ), and cross‑reference with the activation energy from a Kissinger plot. The combination of ( Q ) and ( n ) will point unequivocally to either volume or grain boundary diffusion.
- If your primary focus is to measure the sintering activation energy with the highest possible accuracy: Use the Dorn step‑change method on a high‑response furnace to obtain ( Q ) directly at several density levels, avoiding any assumption of a single kinetic model.
- If your primary focus is to design a production firing curve that maximises density while avoiding residual porosity: Use variable‑rate dilatometry to locate the temperature window where volume or grain boundary diffusion takes over, then set a ramp rate that skips the coarsening regime but remains slow enough to prevent thermal gradients. A dilatometer‑guided rate‑controlled sintering (RCS) profile is your safety net.
- If your primary focus is to minimise energy consumption and furnace time without sacrificing part quality: Exploit the fact that total shrinkage is independent of heating rate. You can safely use a faster ramp through the low‑temperature region and then slow down only when the material enters the critical densification range, as defined by your kinetic data.
With a programmable high‑temperature furnace and a well‑executed variable‑heating‑rate protocol, sintering kinetics transform from a black‑box art into an engineered, predictive process.
Summary Table:
| Kinetic Analysis Method | Primary Formula / Data Point | Key Mechanism & Process Insight |
|---|---|---|
| Kissinger-Like Method | Plot $\ln(\beta / T_p^2)$ vs. $1/T_p$ slope | Calculates overall activation energy ($Q$) using shift in peak shrinkage-rate temp ($T_p$). |
| Dorn Step-Change Method | $Q = \frac{R T_1 T_2}{T_1 - T_2} \ln\left(\frac{V_1}{V_2}\right)$ | Measures instantaneous activation energy ($Q$) model-free via rapid furnace temp jumps. |
| Time Exponent ($n$) | Shrinkage curve fit: $(\Delta L / L_0) = K t^n$ | $n \approx 0.31\text{--}0.33$: Grain boundary diffusion $n \approx 0.4\text{--}0.5$: Volume diffusion |
| Variable Ramping Control | Fast ramps vs. Slow ramps (1–20 K/min) | Fast ramps bypass low-temp surface diffusion coarsening to maximize final density. |
Maximize Sintering Precision & Density with KINTEK
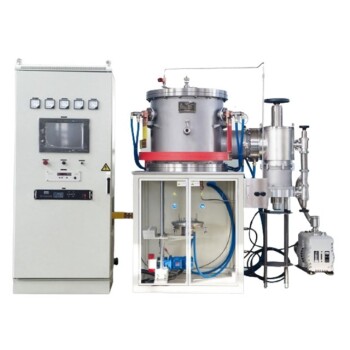
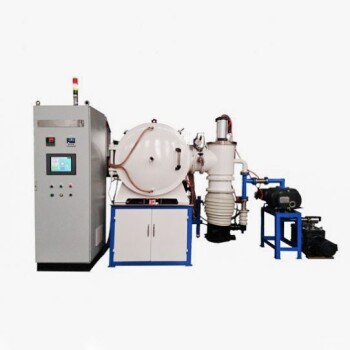
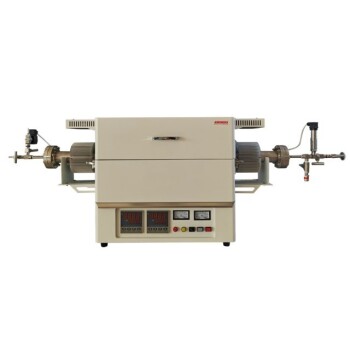
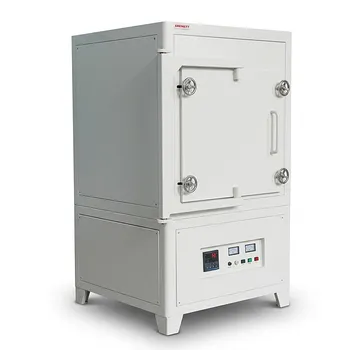
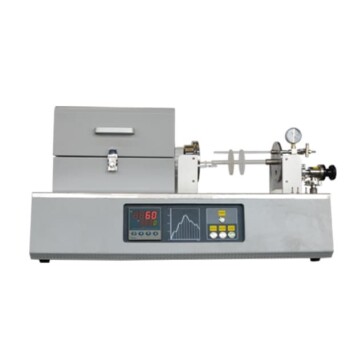
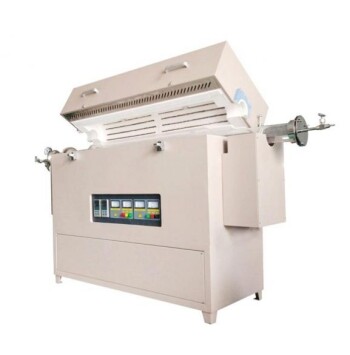
Accurate evaluation of sintering kinetics requires high-performance heating equipment with precise rate control, uniform hot zones, and multi-segment programming. KINTEK specializes in advanced laboratory furnaces—offering custom-engineered vacuum, atmosphere, tube, muffle, CVD, and high-temperature research furnaces designed to deliver rapid thermal response and strict atmospheric integrity.
Whether you are conducting dilatometry studies, optimizing powder metallurgy thermal profiles, or scaling production, KINTEK equips your lab with reliable, tailored high-temp solutions.
Contact KINTEK Today to Enhance Your Lab's Thermal Capabilities
Related Products
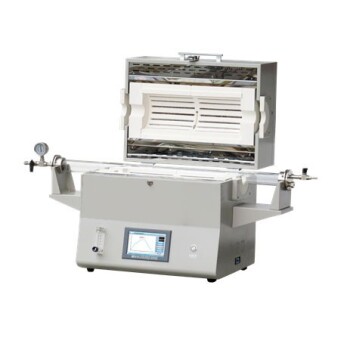
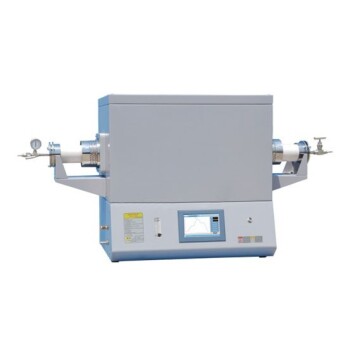
- 1400℃ High Temperature Laboratory Tube Furnace with Alumina Tube
- 1700℃ High Temperature Laboratory Tube Furnace with Alumina Tube
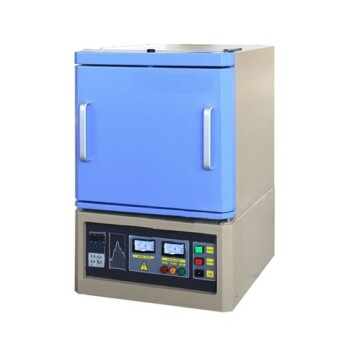
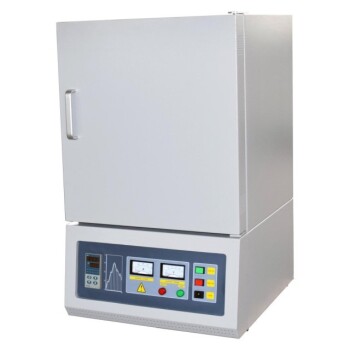
- 1800℃ High Temperature Muffle Oven Furnace for Laboratory
- 1700℃ High Temperature Muffle Oven Furnace for Laboratory
- 1200℃ Muffle Oven Furnace for Laboratory
People Also Ask
- How does zone-melting in tube furnaces synthesize bismuth micro-wires? Master Single-Crystal Thermoelectric Growth
- How do high-temperature laboratory tube furnaces ensure environmental stability? Precision Thermal Reduction Tips
- How are high-temperature laboratory tube furnaces applied in long-term vacuum homogenization heat treatments for intermetallic samples?
- How are high-temp tube furnaces used to measure diffusion coefficients per Fick's law? Master Precision Annealing
- How are high-temperature tube furnaces applied in testing ceramic-supported alloy membranes? Insights