The most direct way to determine densification and volumetric shrinkage of ceramic compacts during thermal processing is to measure relative density and dimensional change. Assuming isotropic (equal in all directions) shrinkage, relative density (\rho) can be calculated from the initial green density (\rho_o) and the linear shrinkage (\Delta L/L_o) using (\rho = \rho_o / (1 - \Delta L/L_o)^3). Porosity (P) is then simply (1 - \rho). These measurements, when tracked against temperature and time, allow researchers to pinpoint the moment of peak densification—before grain coarsening overtakes the process.
The core insight is that densification assessment is not a single value but a dynamic map. By coupling precise shrinkage measurements with the isotropic formula, researchers can derive the evolution of relative density and porosity in real time. The real power, however, comes from using this data to identify the sintering window where densification is fastest and microstructural quality is highest—and to recognize when the critical assumption of isotropic shrinkage is compromised.
How to Quantify Densification: The Two Primary Metrics
You can directly track how a compact consolidates by measuring either its mass–volume relationship or its physical dimensions. The simplest, most informative approach combines both.
Relative Density: Your Direct Measure of Consolidation
Relative density is the ratio of the measured bulk density to the theoretical density of the fully dense material. It immediately tells you how close you are to a pore‑free state.
- A bulk density measurement (Archimedes method, geometric weighing) divided by the known crystallographic density yields a single number between the green fraction and 1.0.
- Tracking relative density across a set of interrupted furnace runs generates a densification curve, revealing exactly when the maximum rate of pore elimination occurs.
Dimensional Shrinkage: Tracking the Macroscopic Change
Shrinkage is the change in linear dimensions of the compact, usually expressed as (\Delta L/L_o) (the fractional change in length). It is fast, non‑destructive, and can be monitored in situ using optical dilatometry.
- By measuring the length of a bar or pellet before and after thermal treatment, you obtain the shrinkage ratio.
- Assuming uniformity, this single linear measurement is enough to feed the isotropic densification equation and derive the new relative density.
The Isotropic Relationship: Calculating Density from Shrinkage
The equation (\rho = \rho_o / (1 - \Delta L/L_o)^3) is the mathematical bridge between dimensional change and densification. It assumes that the compact shrinks equally along all three spatial axes.
- For a green compact at 50% relative density, a linear shrinkage of 20% yields a final relative density of nearly 1.0.
- This formula lets you back‑calculate density without performing a separate bulk density measurement, provided you know the starting green density and the shrinkage is truly isotropic.
The Critical Role of Green Density
The measurement of densification is anchored in the green body you start with. The initial particle packing directly dictates both the magnitude of shrinkage and the accuracy of your final part.
How Initial Packing Dictates Final Shrinkage
Higher green density reduces the absolute linear shrinkage needed to reach full density. This is why pressing formulations are so carefully engineered.
- Raising green density from 50% to 70% of theoretical cuts linear shrinkage from ~20% to ~11%, dramatically easing dimensional tolerance control.
- A compact with low green density must travel a longer shrinkage path, making it more susceptible to warping and internal stress gradients.
Avoiding Localized Stress Through Uniform Green Density
Large local variations in green density create differential shrinkage during heating. These local mismatches are the root cause of many sintering defects.
- Regions of lower packing density shrink more, pulling away from denser regions and generating tensile stresses that lead to cracks or distortion.
- Colloidal forming methods and careful die‑filling practices that produce uniform particle packing are essential to obtaining a reliable, isotropic densification signal.
When the Isotropic Assumption Breaks Down
The simple (\rho = \rho_o / (1 - \Delta L/L_o)^3) equation assumes equal shrinkage in all directions. But real-world forming methods and furnace conditions often violate this assumption, and ignoring anisotropy leads to large density errors.
Sources of Anisotropic Shrinkage
Forming‑induced anisotropy is common in uniaxially pressed parts, where pores become elongated perpendicular to the pressing direction. Particle alignment can also cause greater shrinkage along one axis.
Furnace‑related anisotropy arises from temperature gradients across the furnace hot zone or from friction between the sample and its substrate. Even small thermal variations create asymmetric strain fields.
- Polycrystalline ceramics that densify by solid‑state diffusion (alumina, zirconia) are especially sensitive; under external constraint they develop microstructural texture and may never reach the same density as a freely sintered sample.
- Viscous‑flow materials (glasses, glass‑ceramic composites) are far more forgiving, behaving nearly isotropically even under moderate constraint.
Strategies to Minimize Directional Bias
You can recover the accuracy of the isotropic model by mitigating the sources of anisotropy before you measure.
- Use colloidal or isostatic forming techniques to eliminate particle alignment and elongated pores.
- Reduce substrate friction with a thin layer of inert powder or a polished setter and ensure the furnace heating zone is well‑calibrated for temperature uniformity.
- If anisotropy is unavoidable, measure shrinkage in all three dimensions independently and calculate volumetric shrinkage directly, skipping the cubed linear term.
Beyond the Measurement: Optimizing Your Sintering Schedule
The purpose of measuring densification and shrinkage is not just to record values; it is to drive your thermal process toward the ideal final microstructure.
Identifying the Peak Densification Window
By plotting relative density (and grain size) against furnace temperature or dwell time, you locate the narrow interval where densification dominates over coarsening.
- Densification rate peaks at an intermediate temperature where thermal softening has lowered the yield strength of the compact but before exaggerated grain growth sets in.
- The optimal sintering schedule ends the dwell just as that peak rate begins to decline, locking in high density with the finest possible grains.
Thermal Softening: The Precursor to Rapid Densification
At elevated temperatures, the powder compact loses structural yield strength as the material thermally softens. This softening is the trigger that allows sintering stress to perform densification work.
- The sintering stress itself scales linearly with fractional density, so as the compact softens, the available driving force is unleashed and drives rapid volumetric strain.
- Ensuring uniform heating throughout the high‑temperature furnace guarantees that softening occurs everywhere at the same moment, preventing the warping and cracking that arise from localized densification fronts.
Understanding the Trade-offs
Every measurement approach carries inherent limitations. Acknowledging these trade-offs strengthens your data, not weakens it.
The Simplicity‑Accuracy Trade-off
The isotropic one‑length measurement is fast and non‑destructive, but it collapses all three axes into a single assumption. When anisotropy is present—even minor—the derived density can be significantly off. For critical applications, a direct Archimedes density measurement after cooling is the more reliable endpoint check, even if it loses the continuous in‑situ information.
The Challenge of Constrained Sintering
In thin films or layered structures, the substrate prevents in‑plane shrinkage completely. Here, the isotropic formula fails catastrophically because shrinkage is effectively zero in two dimensions. Researchers working with constrained ceramics must use higher green densities and higher sintering temperatures to reach acceptable final densities, and they must abandon linear shrinkage as a density proxy—volumetric densification must be tracked through mass‑thickness methods instead.
Microstructural Quality vs. Final Density
Chasing the highest possible relative density can come at the expense of grain size. A sample at 98% density with sub‑micrometer grains often outperforms a fully dense component with 10‑µm grains. Your measurement strategy must therefore pair densification data with grain size analysis to ensure you stop the process before abnormal grain growth erodes the very benefit you sought.
How to Apply This to Your Research
Choose the measurement path that aligns with your primary goal, and complement it with the appropriate safeguards.
- If your primary focus is dimensional accuracy: Measure green density meticulously and aim for >60% of theoretical to reduce total shrinkage. Use optical dilatometry to track shrinkage in real time and verify isotropy by comparing two orthogonal dimensions.
- If your primary focus is achieving maximum final density: Run a series of interrupted firings at progressively higher temperatures, measure bulk density by the Archimedes method, and plot relative density versus temperature. Stop when density plateaus—not at the absolute highest number, but before grain size explodes.
- If your primary focus is understanding the sintering mechanism itself: Extract densification rate data at constant density under varying applied pressures in a hot press. Derive the stress exponent (n) to distinguish diffusion‑controlled densification ((n \approx 1)) from plastic flow, and use these maps to design cycles that target specific grain boundary structures.
- If your primary focus is constrained films or coatings: Forget the isotropic assumption. Use high green density from advanced colloidal deposition, accept that final density will never match a free pellet, and apply higher furnace temperatures while closely monitoring grain size to achieve the best possible film quality.
Densification is never just a number—it is a dynamic fingerprint of your processing history, and when you measure it with full awareness of its assumptions and limits, you transform a laboratory furnace from a black box into a precision instrument for microstructural design.
Summary Table:
| Metric / Method | Formula / Primary Tool | Key Advantage | Key Limitation |
|---|---|---|---|
| Relative Density ($\rho$) | $\rho = \text{Bulk Density} / \text{Theoretical Density}$ | Direct measure of pore-free consolidation | Requires density verification after cooling |
| Linear Shrinkage ($\Delta L/L_o$) | Measured via Optical Dilatometry / Calipers | Fast, continuous, in-situ monitoring | Susceptible to directional bias/anisotropy |
| Isotropic Calculation | $\rho = \rho_o / (1 - \Delta L/L_o)^3$ | Calculates real-time density from single dimension | Assumes uniform shrinkage along all 3 axes |
| Archimedes Method | Liquid displacement / mass-volume weighing | Highly accurate endpoint density validation | Requires interrupted firings for continuous data |
Elevate Your Ceramic Sintering Precision with KINTEK
Achieving peak densification without grain coarsening requires ultra-precise temperature control and exceptional hot-zone uniformity. At KINTEK, we specialize in advanced laboratory equipment and high-temperature furnaces engineered to meet the rigorous demands of ceramic research and thermal processing.
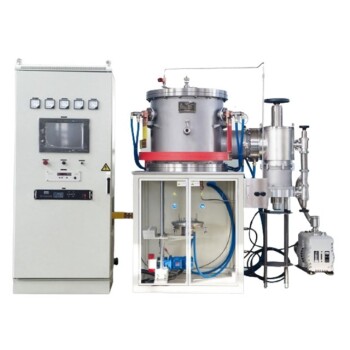
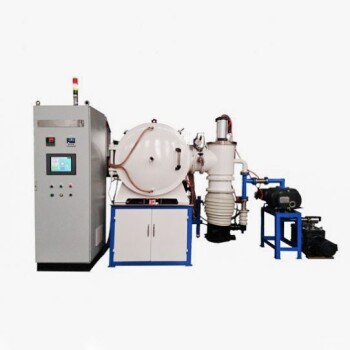
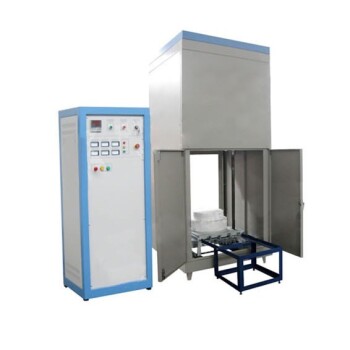
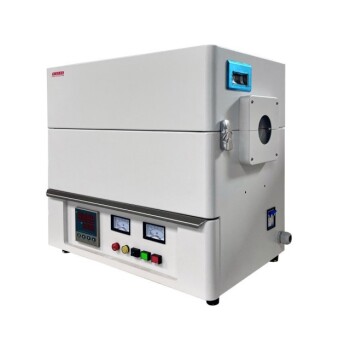
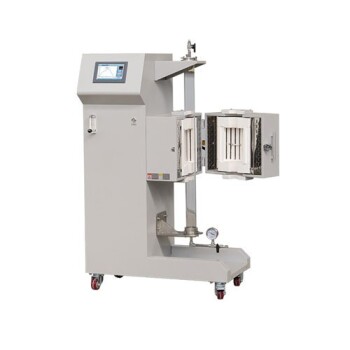
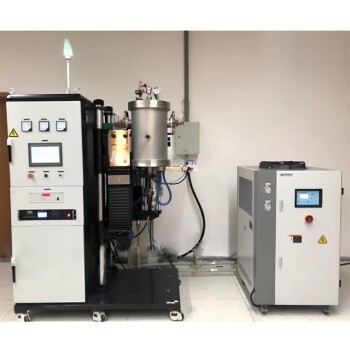
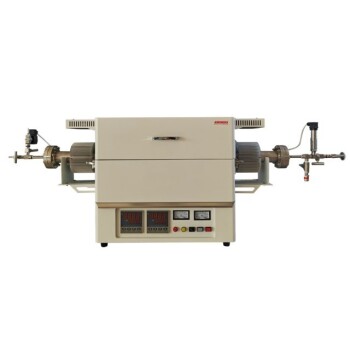
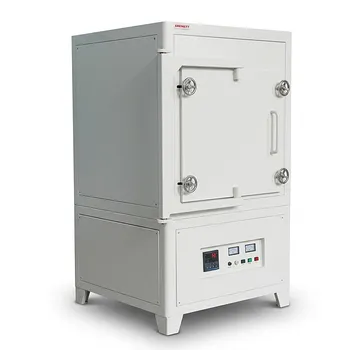
From high-temperature muffle and tube furnaces to vacuum, CVD, atmosphere, rotary, dental, and induction melting furnaces, our solutions are fully customizable to eliminate thermal gradients, prevent sample warping, and ensure reliable, repeatable sintering results.
Take control of your material properties—contact KINTEK today to consult with our technical experts and find the ideal thermal equipment for your laboratory!
Related Products
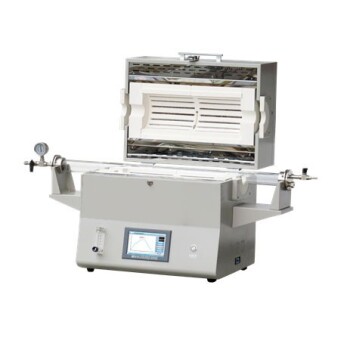
- 1400℃ High Temperature Laboratory Tube Furnace with Alumina Tube
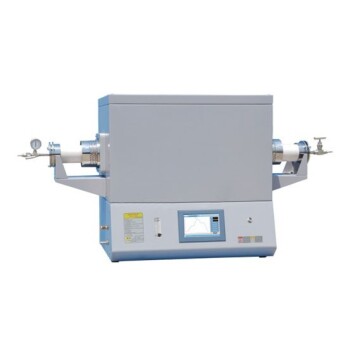
- 1700℃ High Temperature Laboratory Tube Furnace with Alumina Tube
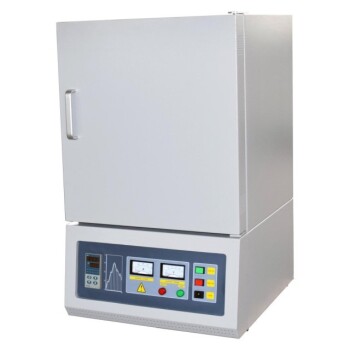
- 1700℃ High Temperature Muffle Oven Furnace for Laboratory
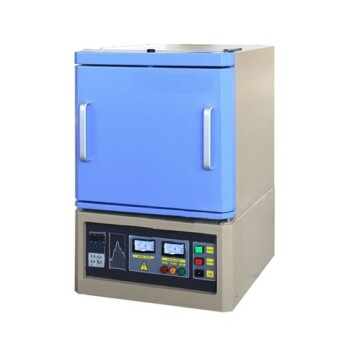
- 1800℃ High Temperature Muffle Oven Furnace for Laboratory
- 1200℃ Muffle Oven Furnace for Laboratory
People Also Ask
- How does zone-melting in tube furnaces synthesize bismuth micro-wires? Master Single-Crystal Thermoelectric Growth
- How do high-temperature laboratory tube furnaces ensure environmental stability? Precision Thermal Reduction Tips
- How are high-temp tube furnaces used to measure diffusion coefficients per Fick's law? Master Precision Annealing
- How are high-temperature laboratory tube furnaces applied in long-term vacuum homogenization heat treatments for intermetallic samples?
- How are high-temperature tube furnaces applied in testing ceramic-supported alloy membranes? Insights