Ashby sintering diagrams give you a visual blueprint of the transport mechanisms at play so you can pinpoint exactly which temperature regimes drive densification versus those that merely coarsen the structure. By referencing these diagrams, laboratory furnace operators can pre-select heating rates that rapidly skip past non-densifying surface diffusion, then program dwell plateaus in the window where grain boundary and lattice diffusion dominate—thereby maximizing density, controlling grain size, and avoiding wasted energy at excessive temperatures.
While built on idealized material constants, an Ashby diagram translates complex sintering kinetics into actionable furnace commands. It reveals the homologous temperature bands where you stop wasting time on neck growth without shrinkage and start building true density—giving you a theoretical launchpad for thermal cycle design, which you then refine empirically for your specific powder.
Decoding the Diagram’s Axes and Mechanism Fields
The Critical Axes: Homologous Temperature and Neck Radius
An Ashby sintering diagram plots homologous temperature (T/Tₘ) on one axis and the normalized neck radius or relative density on the other. Each region of the diagram identifies the single fastest mass transport mechanism operating under those conditions.
Understanding this map is the first step. It immediately shows that sintering is not a one-size-fits-all process; it’s a competition between different atomic highways that become active at different energy levels.
Densifying vs. Non-Densifying Mechanisms
Surface diffusion typically dominates at low homologous temperatures. While it can grow necks between particles, it produces very little shrinkage—you’re building bridges but not pulling the compact together.
Grain boundary diffusion and lattice diffusion from grain boundaries, in contrast, remove material from between particle centers and deposit it at the neck. These mechanisms shrink pores and increase bulk density. Ashby diagrams draw a clear line between these regimes, so you know exactly when your heating profile shifts from surface decoration to true densification.
Translating the Diagram into a Furnace Profile
Leap Past the Surface Diffusion Zone with Ramp Rates
One of the most actionable insights from the diagram is that low-temperature holds are often counterproductive. If your goal is density, long dwells in the surface diffusion region only grow necks without compacting the part.
By setting a rapid heating ramp through the lower homologous temperature band, you minimize the time spent in that non-densifying zone. Your programmable furnace can be told to traverse this region quickly, initiating significant shrinkage only once the temperature reaches the grain boundary or lattice diffusion fields.
Defining the Optimal Dwell Plateau
Once the ramp brings you into the densifying-dominant region identified on the diagram, you program a dwell soak. This is where the bulk of your shrinkage and pore elimination will occur.
The diagram’s contours often indicate the expected neck growth or density for a given time and temperature. You can use this to estimate a starting dwell duration: pick a temperature that sits squarely inside the grain boundary diffusion field, then set an initial soak time that the diagram associates with your target relative density. Your first physical test run then validates and fine-tunes this prediction.
Avoiding Grain Growth at the Top End
Just as the diagram reveals the onset of densification, it also hints at where grain boundary migration and rapid grain coarsening can take over. Operating above a certain homologous temperature for too long may increase density but at the unacceptable cost of exaggerated grain size, which degrades strength.
The diagram helps you define a ceiling temperature—a point where the densification gain no longer justifies the microstructural penalty. You can then program your furnace to hold below that ceiling, balancing density and mechanical properties.
Understanding the Practical Trade-offs
Material Constants Shrink the Map’s Precision
Ashby diagrams are constructed using assumed material parameters such as diffusion coefficients and surface energies. In real powders, variations in purity, particle size distribution, or surface contaminants can shift the boundaries by tens of degrees.
This means the diagram is a guiding hypothesis, not a guaranteed setpoint. You must treat the predicted temperature window as a starting point, then run a focused set of experimental boules or witness bars to locate the actual densification frontier for your lot of material.
Non-Isothermal Realities vs. Isothermal Assumptions
Many sintering diagrams are built for idealized isothermal holds. Your furnace, however, heats the compact dynamically. The cumulative shrinkage during the ramp can be significant, and the dominant mechanism may shift as you pass through different temperature bands.
Furnace operators can bridge this gap by dividing the cycle into incremental time–temperature steps and using the diagram to model which mechanism dominates in each segment. That informs a multi-stage profile where each ramp rate and dwell targets a specific mechanical objective, moving from binder burnout through densification to controlled cooling.
Diagrams Ignore Atmosphere and Liquid Phases
Ashby diagrams typically model solid-state sintering in a neutral environment. They do not capture how an active atmosphere—a forming gas that reduces surface oxides, or a reactive additive that introduces a transient liquid—fundamentally alters the dominant transport path.
Therefore, the temperature you extract from the diagram may need to be lowered if you are using liquid-phase sintering or an atmosphere that enhances diffusion. The diagram remains your anchor for solid-state densification, but real-world profiles often combine its guidance with phase equilibrium data and atmosphere strategies.
Making Diagrams Work for Your Specific Goal
Use the Ashby diagram as your theoretical baseline, then adjust based on your primary target.
- If your primary focus is maximizing final density: Pick a dwell temperature that sits deep inside the grain boundary or lattice diffusion field on the diagram, and ramp vigorously through the low-temperature surface diffusion zone to limit non-densifying coarsening.
- If your primary focus is controlling grain size: Identify the temperature contour where sufficient densification occurs before grain boundary migration accelerates. Program a soak at that lower bound, and accept a slightly longer cycle for a finer final microstructure.
- If your primary focus is reducing total cycle time: Use the diagram to locate the minimum temperature that activates densifying diffusion. Combine a steep ramp with a short, high-intensity dwell at that threshold, then validate against density and crack sensitivity.
- If your primary focus is a new material: Overlay several diagram assumptions (e.g., varying particle size) to generate a band of “likely densification windows,” then run a few discrete sintering experiments bracketing that band to quickly map the real behavior of your powder.
With Ashby sintering diagrams as your theoretical compass and a disciplined approach to empirical verification, you transform your high-temperature lab furnace from a blind heating box into a precision instrument for engineering density and microstructure.
Summary Table:
| Mechanism / Phase | Transport Path | Effect on Compact | Furnace Strategy |
|---|---|---|---|
| Surface Diffusion | Surface to neck | Neck growth without shrinkage (coarsening) | Set rapid ramp rates to bypass non-densifying zones |
| Grain Boundary / Lattice Diffusion | Grain boundary/bulk to neck | Pore elimination and true bulk densification | Program isothermal dwell plateau in optimal field |
| Exaggerated Grain Growth | Rapid boundary migration | Coarsening, microstructural degradation | Limit dwell time and establish a maximum temperature ceiling |
Turn Sintering Diagrams into Precise Thermal Execution with KINTEK
Translating sintering kinetics into high-density microstructures demands extreme furnace accuracy and controllable heating profiles. At KINTEK, we supply high-performance, fully customizable laboratory equipment designed to meet your exact metallurgical and advanced ceramic research requirements.
From high-temperature muffle, tube, and rotary furnaces to specialized vacuum, atmosphere, CVD, dental, and induction melting systems, KINTEK equipment gives laboratory operators complete control over ramp rates, atmosphere environments, and dwell plateaus.
Ready to eliminate trial-and-error in your thermal cycles? Contact KINTEK today to discuss your custom furnace needs with our high-temperature equipment experts!
Related Products
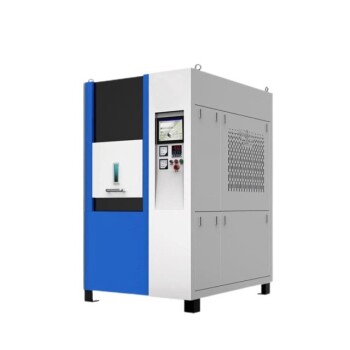
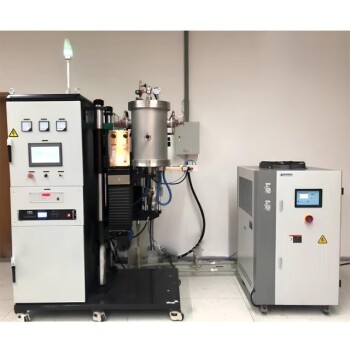
- Spark Plasma Sintering SPS Furnace
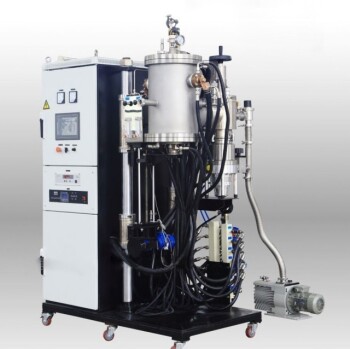
- Small Vacuum Heat Treat and Tungsten Wire Sintering Furnace
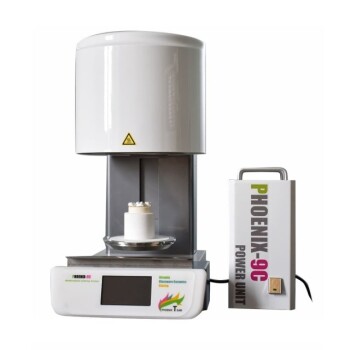
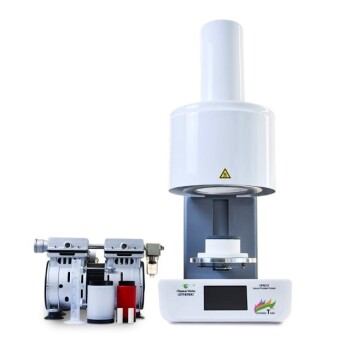
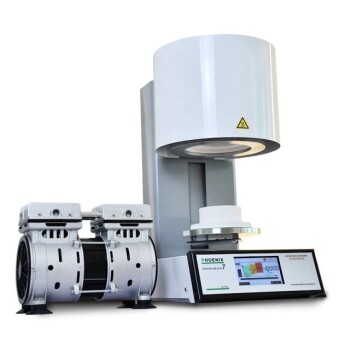
- Chairside Dental Porcelain Zirconia Sintering Furnace with Transformer for Ceramic Restorations
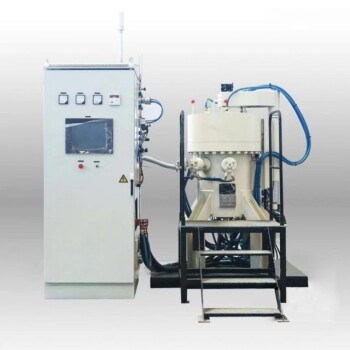
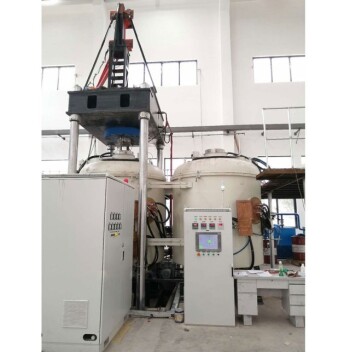
- 9MPa Air Pressure Vacuum Heat Treat and Sintering Furnace
- Vacuum Heat Treat Sintering Furnace with Pressure for Vacuum Sintering
People Also Ask
- Why is it necessary to maintain a high vacuum environment during the SPS of SiC? Key to High-Density Ceramics
- How does the heating mechanism of Spark Plasma Sintering (SPS) function? Enhance TiC/SiC Composite Fabrication
- What are the technical advantages of using an SPS sintering furnace? Elevate Al2O3-TiC Material Performance
- What are the advantages of Spark Plasma Sintering (SPS)? Achieve Superior Microstructures
- What are the steps in the discharge plasma sintering process? Master Fast, High-Density Material Consolidation