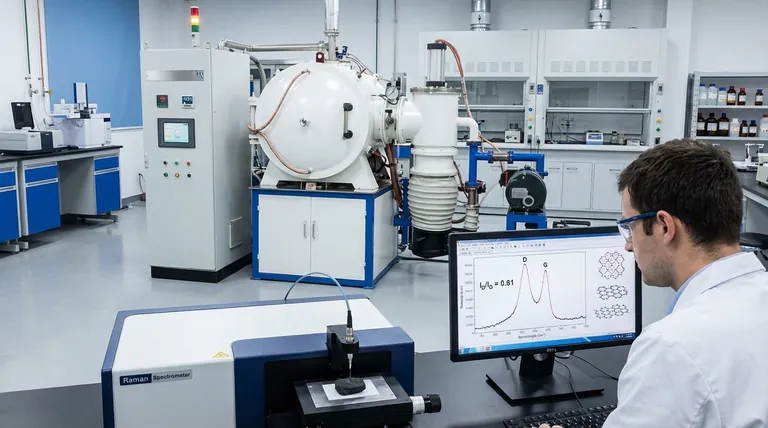
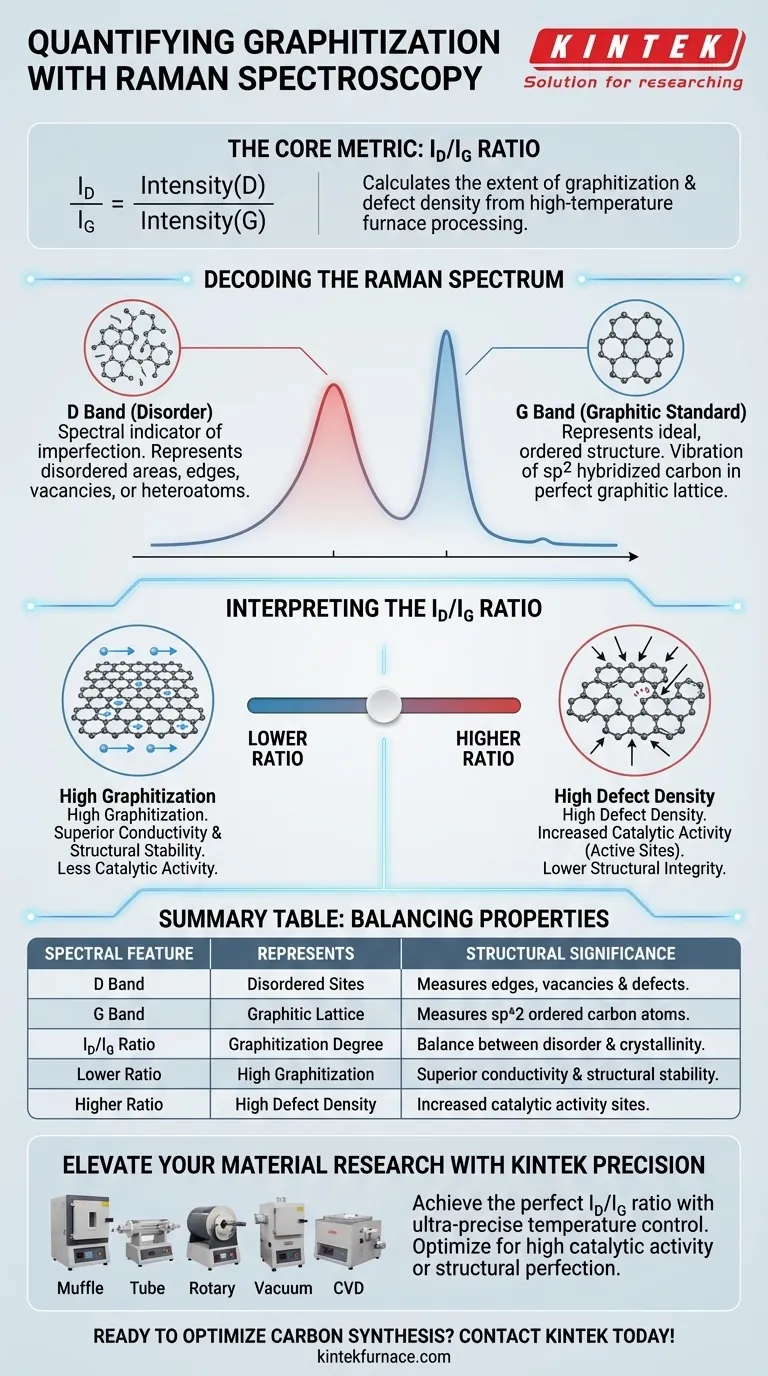
The graphitization degree is quantified by calculating the $I_D/I_G$ ratio. This metric compares the intensity of the D band, which represents disordered or defect sites, against the intensity of the G band, which corresponds to organized, $sp^2$ hybridized graphitic carbon. By analyzing this ratio, researchers can precisely determine the extent of graphitization and the density of defect sites generated during high-temperature furnace processing.
The $I_D/I_G$ ratio serves as the definitive metric for characterizing carbonized materials, providing a direct correlation between the material's structural defects and its potential for catalytic activity.
Decoding the Raman Spectrum
To understand the quality of materials like carbonized Zeolitic Imidazolate Frameworks (ZIFs), you must first isolate the two critical spectral signatures produced by Raman spectroscopy.
The D Band: Measuring Disorder
The D band is the spectral indicator of imperfection.
It represents the disordered areas or defect sites within the carbon structure. A prominent D band suggests a structure rich in edges, vacancies, or heteroatoms, which are often the result of specific furnace processing conditions.
The G Band: The Graphitic Standard
The G band represents the ideal, ordered structure.
It corresponds to the vibration of $sp^2$ hybridized carbon atoms found in a perfect graphitic lattice. A sharp, intense G band indicates a high degree of crystalline order and successful graphitization.
Interpreting the $I_D/I_G$ Ratio
The raw data from the D and G bands is synthesized into a single, actionable value: the intensity ratio.
Quantifying Structural Evolution
The $I_D/I_G$ ratio acts as a sliding scale for material evolution.
By dividing the intensity of the defect band (D) by the graphitic band (G), you obtain a numerical value representing the graphitization degree. This reveals how effectively the high-temperature furnace converted the precursor material into a structured carbon network.
Linking Structure to Performance
This ratio is not just structural data; it is a performance predictor.
The primary reference notes that the density of defect sites—quantified by this ratio—directly correlates to the material's catalytic activity. In many catalytic applications, specific defects are necessary "active sites," making this measurement critical for predicting how the material will behave in a chemical reaction.
Understanding the Trade-offs
While Raman spectroscopy provides a powerful quantitative tool, interpreting the "ideal" ratio requires context regarding your end goal.
Defect Density vs. Conductivity
A lower $I_D/I_G$ ratio indicates high graphitization, implying excellent electrical conductivity and structural stability.
However, a "perfect" graphitic structure might lack the active defect sites required for certain catalytic reactions. Conversely, a higher ratio suggests high activity potential but may indicate lower structural integrity. The "best" ratio is defined entirely by the specific balance of conductivity and reactivity your application requires.
Making the Right Choice for Your Goal
Raman spectroscopy allows you to tune your furnace parameters to achieve the precise material properties needed for your application.
- If your primary focus is high catalytic activity: Target a specific $I_D/I_G$ ratio that indicates a sufficient density of defect sites, as these often serve as the active centers for reaction.
- If your primary focus is structural order: Look for a lower $I_D/I_G$ ratio, which confirms the dominance of the G band and a highly graphitized, stable carbon network.
By mastering the $I_D/I_G$ ratio, you convert raw spectral data into a precise blueprint for material performance.
Summary Table:
| Spectral Feature | Represents | Structural Significance |
|---|---|---|
| D Band | Disordered Sites | Measures edges, vacancies, and structural defects. |
| G Band | Graphitic Lattice | Measures $sp^2$ hybridized, ordered carbon atoms. |
| $I_D/I_G$ Ratio | Graphitization Degree | Quantifies the balance between disorder and crystallinity. |
| Lower Ratio | High Graphitization | Indicates superior conductivity and structural stability. |
| Higher Ratio | High Defect Density | Often correlates with increased catalytic activity sites. |
Elevate Your Material Research with KINTEK Precision
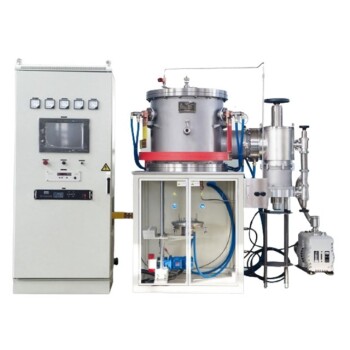
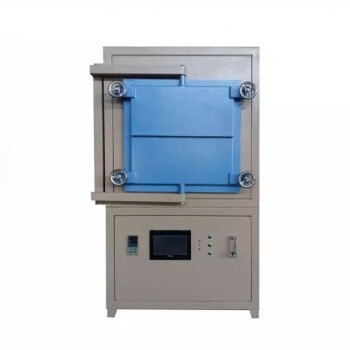
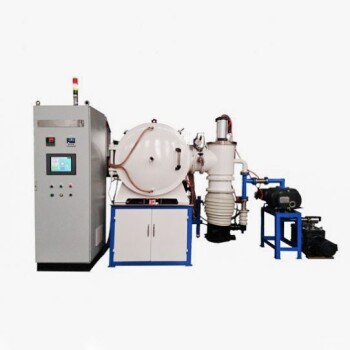
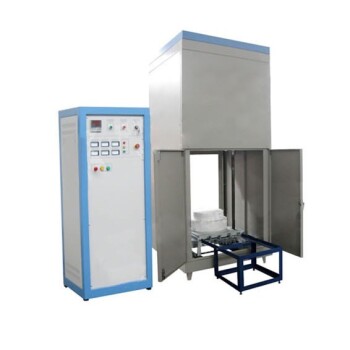
Achieving the perfect $I_D/I_G$ ratio requires the ultra-precise temperature control found only in professional-grade thermal systems. KINTEK provides industry-leading Muffle, Tube, Rotary, Vacuum, and CVD systems, all engineered to help you master the graphitization process.
Whether you are targeting high catalytic activity or crystalline structural perfection, our customizable lab high-temp furnaces are backed by expert R&D to meet your unique material specifications.
Ready to optimize your carbon synthesis? Contact KINTEK today to find your custom furnace solution!
Visual Guide
References
- Yan Yang, Gai Zhang. Enhanced Electrocatalytic Activity for ORR Based on Synergistic Effect of Hierarchical Porosity and Co-Nx Sites in ZIF-Derived Heteroatom-Doped Carbon Materials. DOI: 10.3390/c11030070
This article is also based on technical information from Kintek Furnace Knowledge Base .
Related Products
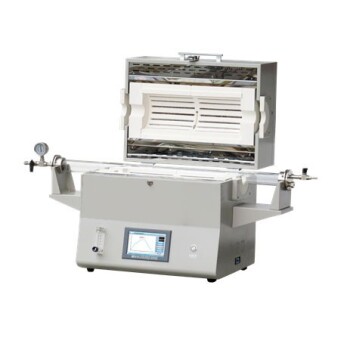
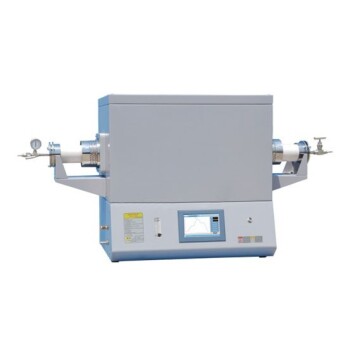
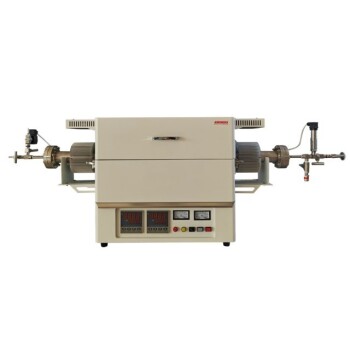
- 1400℃ High Temperature Laboratory Tube Furnace with Alumina Tube
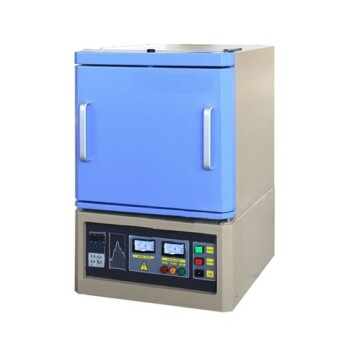
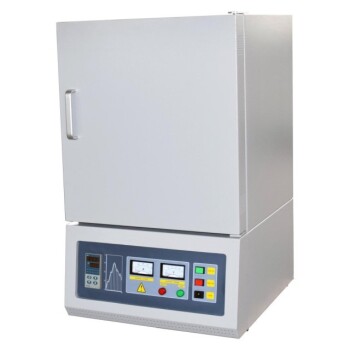
- 1800℃ High Temperature Muffle Oven Furnace for Laboratory
- 1700℃ High Temperature Laboratory Tube Furnace with Alumina Tube
- 1700℃ High Temperature Muffle Oven Furnace for Laboratory
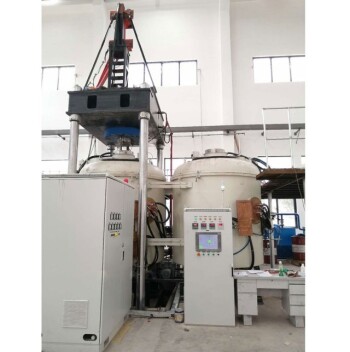
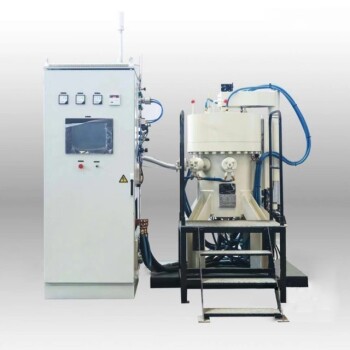
- 1700℃ Controlled Inert Nitrogen Atmosphere Furnace
People Also Ask
- What is the mechanism of a high-temperature furnace in Bi-2223 sintering? Achieve Precision Phase Transformation
- How do high-temperature laboratory tube furnaces ensure environmental stability? Precision Thermal Reduction Tips
- How does a high-temperature tube furnace facilitate sulfur melt-diffusion? Precision Heating for PCFC/S Cathodes
- In what scenarios are laboratory high-temperature tube furnaces or muffle furnaces utilized? Study MgTiO3-CaTiO3 Ceramics
- What is a high temperature tube furnace? Achieve Precise Heat and Atmosphere Control